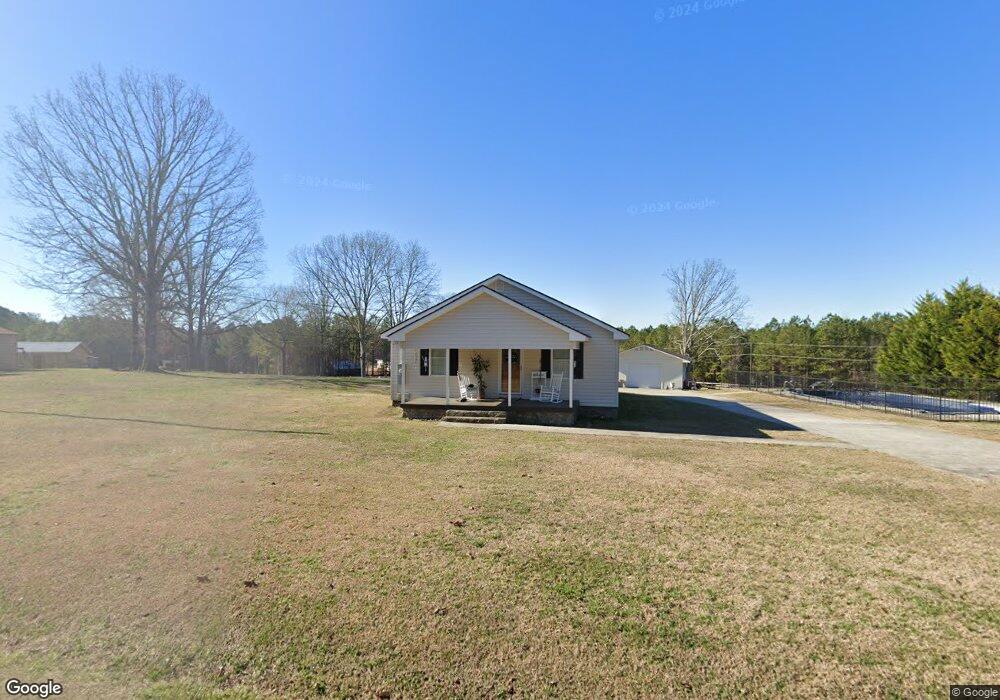
772 Taylorsville Rd Aragon, GA 30104
Estimated Value: $219,845 - $700,000
--
Bed
1
Bath
1,302
Sq Ft
$267/Sq Ft
Est. Value
About This Home
This home is located at 772 Taylorsville Rd, Aragon, GA 30104 and is currently estimated at $347,211, approximately $266 per square foot. 772 Taylorsville Rd is a home located in Floyd County with nearby schools including Pepperell Middle School and Pepperell High School.
Ownership History
Date
Name
Owned For
Owner Type
Purchase Details
Closed on
Jul 15, 1996
Sold by
Bishop Bishop J and Bishop Melissa L
Bought by
Bishop Jerry Allen
Current Estimated Value
Purchase Details
Closed on
Nov 7, 1995
Sold by
Greystone Servicing Corporation Inc
Bought by
Secretary Of Housing & Urban Development
Purchase Details
Closed on
Jan 15, 1992
Sold by
Blazer Financial Services
Bought by
Queen Patricia Gail and Queen Walter
Purchase Details
Closed on
Aug 6, 1991
Sold by
Osborne Eddie L and Osborne Linda F
Bought by
Blazer Financial Services
Purchase Details
Closed on
Mar 22, 1991
Bought by
P and R
Purchase Details
Closed on
May 27, 1977
Sold by
Fricks Robert L
Bought by
Osborne Eddie L and Osborne Linda F
Purchase Details
Closed on
Aug 6, 1968
Sold by
Roper M S
Bought by
Fricks Robert L
Purchase Details
Closed on
Feb 11, 1953
Bought by
Roper M S
Create a Home Valuation Report for This Property
The Home Valuation Report is an in-depth analysis detailing your home's value as well as a comparison with similar homes in the area
Home Values in the Area
Average Home Value in this Area
Purchase History
| Date | Buyer | Sale Price | Title Company |
|---|---|---|---|
| Bishop Jerry Allen | -- | -- | |
| Bishop Bishop J | -- | -- | |
| Secretary Of Housing & Urban Development | $64,400 | -- | |
| Greystone Servicing Corporation Inc | $64,400 | -- | |
| Queen Patricia Gail | $55,000 | -- | |
| Blazer Financial Services | $51,600 | -- | |
| P | -- | -- | |
| Osborne Eddie L | $20,000 | -- | |
| Fricks Robert L | $9,500 | -- | |
| Roper M S | -- | -- |
Source: Public Records
Tax History Compared to Growth
Tax History
| Year | Tax Paid | Tax Assessment Tax Assessment Total Assessment is a certain percentage of the fair market value that is determined by local assessors to be the total taxable value of land and additions on the property. | Land | Improvement |
|---|---|---|---|---|
| 2024 | $1,556 | $75,021 | $20,233 | $54,788 |
| 2023 | $1,421 | $66,071 | $18,394 | $47,677 |
| 2022 | $1,166 | $49,867 | $15,213 | $34,654 |
| 2021 | $996 | $40,528 | $13,841 | $26,687 |
| 2020 | $901 | $34,970 | $12,036 | $22,934 |
| 2019 | $871 | $33,826 | $12,036 | $21,790 |
| 2018 | $841 | $32,129 | $11,464 | $20,665 |
| 2017 | $815 | $30,590 | $10,615 | $19,975 |
| 2016 | $815 | $30,082 | $10,600 | $19,482 |
| 2015 | $799 | $30,082 | $10,600 | $19,482 |
| 2014 | $799 | $30,082 | $10,600 | $19,482 |
Source: Public Records
Map
Nearby Homes
- 320 Brumbelow Rd
- 2011 Bailey Rd SE
- 2557 Wax Rd SE
- 1337 Abrams Rd SE
- 52 Lloyd Dr SE
- 00 John Kay Rd
- 1424 Harmony Rd SE
- 110 Williams Rd SE
- 838 Pleasant Hope Rd SE
- 463 Compton Rd SE
- 0 John Kay Rd Unit 10497667
- 0 John Kay Rd Unit 22982738
- 0 John Kay Rd Unit 10451223
- 0 John Kay Rd Unit 10451216
- 0 John Kay Rd Unit 22961830
- 0 John Kay Rd Unit 7517782
- 0 John Kay Rd Unit 22961024
- 167 Iron Hill Rd
- 119 Satcher Rd
- 790 Taylorsville Rd
- 799 Taylorsville Rd
- 694 Taylorsville Rd
- 749 Taylorsville Rd
- 803 Taylorsville Rd
- 825 Taylorsville Rd
- 54 Aragon Taylorsville Rd
- 60 Aragon Taylorsville Rd
- 687 Taylorsville Rd
- 870 Taylorsville Rd
- 881 Taylorsville Rd
- 652 Taylorsville Rd
- 633 Taylorsville Rd
- 607 Taylorsville Rd
- Delete Taylorsville Rd
- 50 Brumbelow Rd
- 600 Taylorsville Rd
- 600 Taylorsville Rd
- 591 Taylorsville Rd
- 1654 Bailey Rd SE