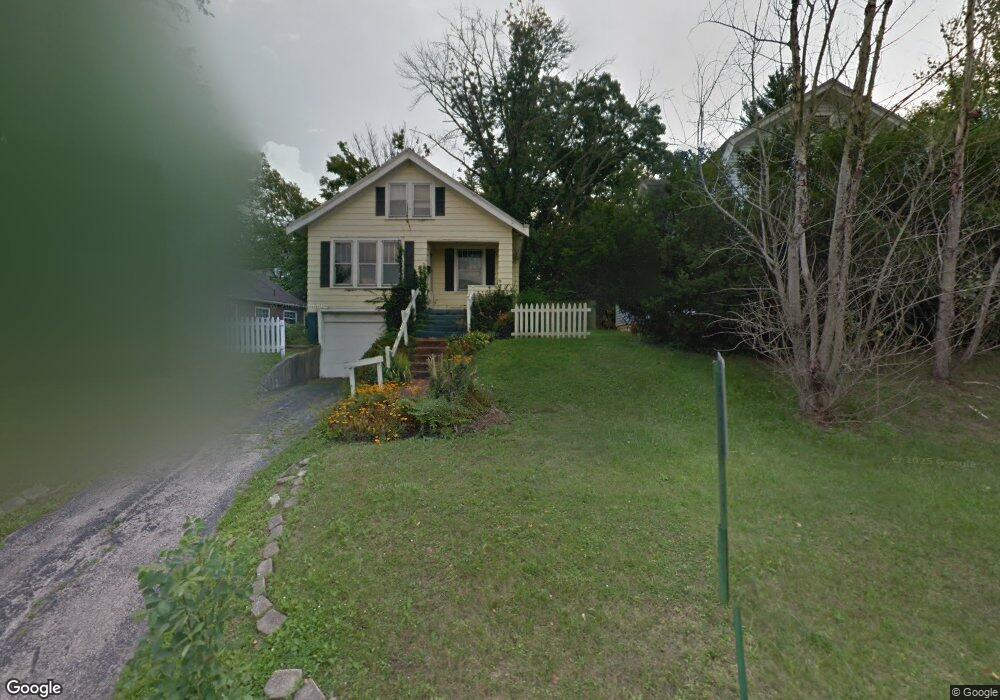
7721 Camargo Rd Cincinnati, OH 45243
Estimated Value: $291,000 - $415,000
3
Beds
1
Bath
906
Sq Ft
$392/Sq Ft
Est. Value
About This Home
This home is located at 7721 Camargo Rd, Cincinnati, OH 45243 and is currently estimated at $355,472, approximately $392 per square foot. 7721 Camargo Rd is a home located in Hamilton County with nearby schools including Madeira Elementary School, Madeira Middle School, and Madeira High School.
Ownership History
Date
Name
Owned For
Owner Type
Purchase Details
Closed on
Jul 22, 2008
Sold by
Haas Kathleen M
Bought by
Mra Properties Llc
Current Estimated Value
Purchase Details
Closed on
Mar 11, 2005
Sold by
Moore Bryon D and Moore Virve A
Bought by
Haas Kathleen M
Home Financials for this Owner
Home Financials are based on the most recent Mortgage that was taken out on this home.
Original Mortgage
$126,400
Interest Rate
5.67%
Mortgage Type
Fannie Mae Freddie Mac
Purchase Details
Closed on
Sep 26, 1995
Sold by
Lange Cynthia A and Lane Cynthia A
Bought by
Moore Bryon D and Moore Virve A
Home Financials for this Owner
Home Financials are based on the most recent Mortgage that was taken out on this home.
Original Mortgage
$69,300
Interest Rate
7.91%
Purchase Details
Closed on
Aug 20, 1993
Sold by
Freudenberg Erik Gustave and Mattes Erik G
Bought by
Lane Cynthia A and Lane Edmund J
Create a Home Valuation Report for This Property
The Home Valuation Report is an in-depth analysis detailing your home's value as well as a comparison with similar homes in the area
Home Values in the Area
Average Home Value in this Area
Purchase History
| Date | Buyer | Sale Price | Title Company |
|---|---|---|---|
| Mra Properties Llc | $160,000 | None Available | |
| Haas Kathleen M | $158,000 | Expedient Title Ltd | |
| Moore Bryon D | -- | -- | |
| Lane Cynthia A | -- | -- |
Source: Public Records
Mortgage History
| Date | Status | Borrower | Loan Amount |
|---|---|---|---|
| Previous Owner | Haas Kathleen M | $126,400 | |
| Previous Owner | Moore Bryon D | $69,300 |
Source: Public Records
Tax History Compared to Growth
Tax History
| Year | Tax Paid | Tax Assessment Tax Assessment Total Assessment is a certain percentage of the fair market value that is determined by local assessors to be the total taxable value of land and additions on the property. | Land | Improvement |
|---|---|---|---|---|
| 2024 | $5,114 | $84,652 | $41,087 | $43,565 |
| 2023 | $5,087 | $84,652 | $41,087 | $43,565 |
| 2022 | $4,156 | $56,673 | $28,760 | $27,913 |
| 2021 | $4,147 | $56,673 | $28,760 | $27,913 |
| 2020 | $3,961 | $59,774 | $28,760 | $31,014 |
| 2019 | $3,852 | $53,372 | $25,680 | $27,692 |
| 2018 | $3,880 | $53,372 | $25,680 | $27,692 |
| 2017 | $3,732 | $53,372 | $25,680 | $27,692 |
| 2016 | $3,792 | $50,586 | $13,997 | $36,589 |
| 2015 | $3,474 | $50,586 | $13,997 | $36,589 |
| 2014 | $3,488 | $50,586 | $13,997 | $36,589 |
| 2013 | $3,320 | $46,411 | $12,842 | $33,569 |
Source: Public Records
Map
Nearby Homes
- 6702 Miami Ave
- 7024 Maple Ave
- 7474 Dawson Rd
- 7834 Laurel Ave
- 7389 Southside Ave
- 7827 Euclid Ave
- 7845 Euclid Ave
- 7108 Fowler Ave
- 7156 Maple Ave
- 6516 Willow Hollow Ln
- 7317 Euclid Ave
- 7471 Mar Del Dr
- 7210 Fowler Ave
- 7406 Dawson Rd
- 7500 Mar Del Dr
- 6680 N Clippinger Dr
- 8012 Euclid Ave
- 7231 Berwood Dr
- 7251 Miami Ave
- 7811 Shawnee Run Rd
- 7717 Camargo Rd
- 7723 Dones Ave
- 7727 Dones Ave
- 7715 Camargo Rd
- 7715 Camargo Rd Unit 7721
- 7729 Dones Ave
- 6809 Marvin Ave
- 7724 Naomi Ave
- 6807 Marvin Ave
- 7731 Dones Ave
- 7720 Naomi Ave
- 7726 Naomi Ave
- 7800 Camargo Rd
- 7732 Naomi Ave
- 7716 Naomi Ave
- 7714 Naomi Ave
- 7734 Naomi Ave
- 6910 Miami Ave
- 6914 Miami Ave
- 6914 Miami Ave Unit A