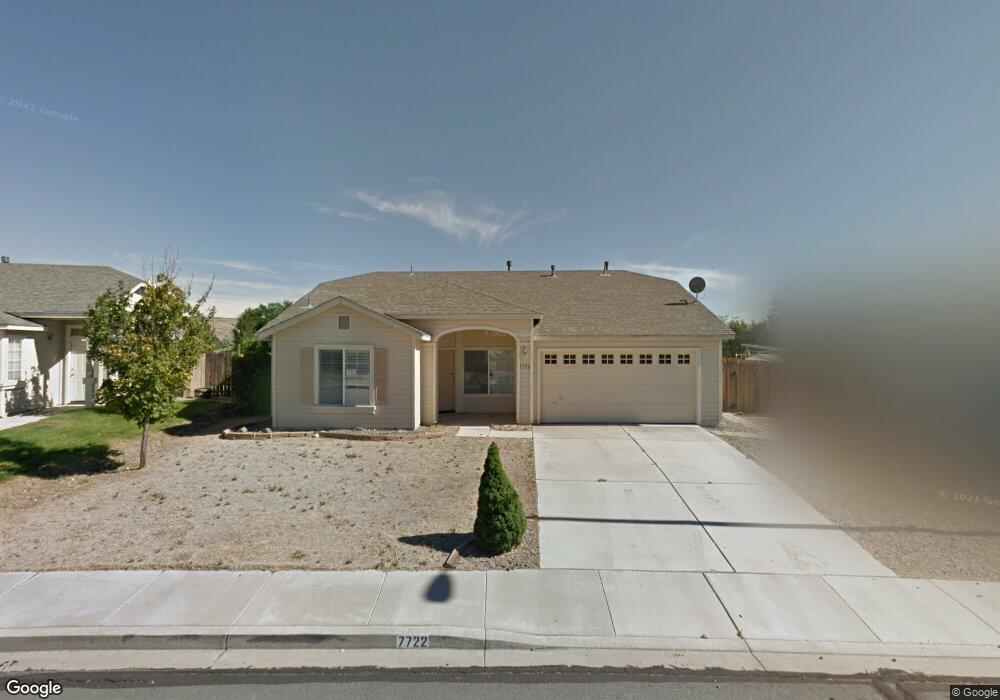
7722 Cerritos Cir Sparks, NV 89436
Wingfield Springs NeighborhoodEstimated Value: $492,000 - $521,000
3
Beds
2
Baths
1,440
Sq Ft
$349/Sq Ft
Est. Value
About This Home
This home is located at 7722 Cerritos Cir, Sparks, NV 89436 and is currently estimated at $502,582, approximately $349 per square foot. 7722 Cerritos Cir is a home located in Washoe County with nearby schools including Southern Elementary School, Van Gorder Elementary School, and Sky Ranch Middle School.
Ownership History
Date
Name
Owned For
Owner Type
Purchase Details
Closed on
Aug 25, 2017
Sold by
Mckennie Thomas A and Mckennie Margaret E
Bought by
Mckennie Realty Llc
Current Estimated Value
Purchase Details
Closed on
Jan 13, 2014
Sold by
Harms Erin M and Harms Michael E
Bought by
Mckennie Tom
Purchase Details
Closed on
Jun 6, 2006
Sold by
Harms Michael E and Harms Erin D
Bought by
Rwc Holdings Llc and Harms 7722 Cerritos Trust
Purchase Details
Closed on
Jun 8, 1999
Sold by
Bighorn Development Ii Ltd
Bought by
Harms Michael E and Harms Erin M
Home Financials for this Owner
Home Financials are based on the most recent Mortgage that was taken out on this home.
Original Mortgage
$130,782
Interest Rate
3.42%
Create a Home Valuation Report for This Property
The Home Valuation Report is an in-depth analysis detailing your home's value as well as a comparison with similar homes in the area
Home Values in the Area
Average Home Value in this Area
Purchase History
| Date | Buyer | Sale Price | Title Company |
|---|---|---|---|
| Mckennie Realty Llc | -- | None Available | |
| Mckennie Thomas A | -- | None Available | |
| Mckennie Tom | $156,700 | None Available | |
| Rwc Holdings Llc | -- | None Available | |
| Harms Michael E | $145,500 | First American Title Co |
Source: Public Records
Mortgage History
| Date | Status | Borrower | Loan Amount |
|---|---|---|---|
| Previous Owner | Harms Michael E | $130,782 |
Source: Public Records
Tax History Compared to Growth
Tax History
| Year | Tax Paid | Tax Assessment Tax Assessment Total Assessment is a certain percentage of the fair market value that is determined by local assessors to be the total taxable value of land and additions on the property. | Land | Improvement |
|---|---|---|---|---|
| 2025 | $1,764 | $95,531 | $36,855 | $58,676 |
| 2024 | $1,764 | $91,453 | $32,200 | $59,253 |
| 2023 | $2,291 | $92,801 | $36,750 | $56,051 |
| 2022 | $2,225 | $75,246 | $28,490 | $46,757 |
| 2021 | $2,230 | $69,589 | $22,995 | $46,594 |
| 2020 | $2,096 | $70,387 | $23,625 | $46,762 |
| 2019 | $1,996 | $67,162 | $21,875 | $45,287 |
| 2018 | $1,906 | $60,174 | $15,785 | $44,389 |
| 2017 | $1,829 | $59,885 | $15,365 | $44,520 |
| 2016 | $1,783 | $58,792 | $13,685 | $45,107 |
| 2015 | $1,780 | $58,540 | $13,405 | $45,135 |
| 2014 | $1,717 | $53,901 | $10,430 | $43,471 |
| 2013 | -- | $43,948 | $8,155 | $35,793 |
Source: Public Records
Map
Nearby Homes
- 7635 Badelona Ct
- 3663 Copernicus Ct
- 7778 Cerritos Cir Unit 7
- 7464 Europa Dr
- 7718 Rhythm Cir
- 7483 Europa Dr
- 3716 Early Dawn Dr
- 7366 Grand Island Dr
- 7311 S Florentine Dr Unit 10A
- 3245 Gerona Ct
- 7260 Treeline Ct
- 7423 Comet Ct
- 7240 Silver King Dr
- 7220 Windswept Loop
- 7315 Silver King Dr
- 7480 Windswept Loop
- 7045 Krug Dr
- 8570 Eaglenest Rd
- 3706 Deutz Dr
- 7422 Windswept Loop
- 7726 Cerritos Cir
- 7718 Cerritos Cir
- 7714 Cerritos Cir
- 7730 Cerritos Cir
- 3382 Toledo Ct
- 3374 Toledo Ct
- 7727 Cerritos Cir
- 7717 Cerritos Cir
- 7734 Cerritos Cir
- 7710 Cerritos Cir
- 7709 Cerritos Cir
- 3390 Toledo Ct
- 3358 Toledo Ct
- 7738 Cerritos Cir
- 3133 Minino Ct
- 3143 Minino Ct
- 3398 Toledo Ct
- 7703 Cerritos Cir Unit 7
- 3350 Toledo Ct
- 3113 Minino Ct