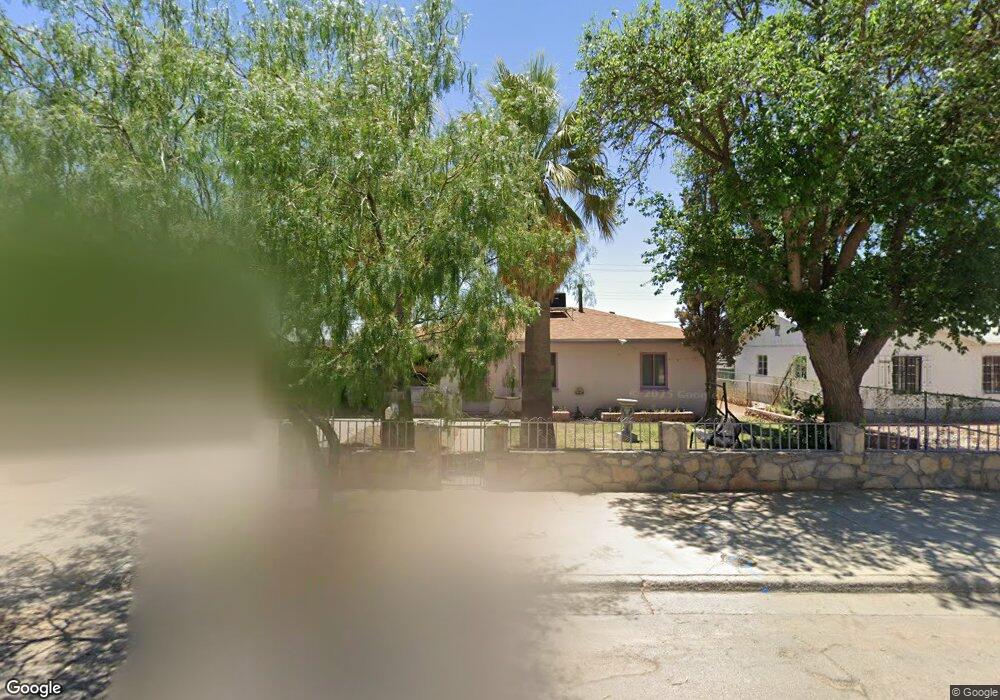
7724 Ranchland Dr El Paso, TX 79915
Hacienda Heights NeighborhoodEstimated Value: $194,000 - $219,000
--
Bed
2
Baths
1,710
Sq Ft
$120/Sq Ft
Est. Value
About This Home
This home is located at 7724 Ranchland Dr, El Paso, TX 79915 and is currently estimated at $204,372, approximately $119 per square foot. 7724 Ranchland Dr is a home located in El Paso County with nearby schools including Hacienda Heights Elementary School, North Loop Elementary School, and Bel Air Middle.
Ownership History
Date
Name
Owned For
Owner Type
Purchase Details
Closed on
Feb 14, 2019
Sold by
Cobos Irene Evangelina and Cobos Irene G
Bought by
Cobos Bernabe
Current Estimated Value
Purchase Details
Closed on
Nov 4, 2010
Sold by
Cobos Paul Barney
Bought by
Cobos Irene Evangelina Grado and Cobos Irene G
Purchase Details
Closed on
Sep 19, 1996
Sold by
Herrera Victor M Arreola
Bought by
Cobos Bernabe
Home Financials for this Owner
Home Financials are based on the most recent Mortgage that was taken out on this home.
Original Mortgage
$50,291
Outstanding Balance
$4,204
Interest Rate
7.9%
Mortgage Type
Seller Take Back
Estimated Equity
$200,168
Purchase Details
Closed on
Nov 3, 1995
Sold by
Church Of Saint Christopher Episcopal
Bought by
Cobos Ben
Home Financials for this Owner
Home Financials are based on the most recent Mortgage that was taken out on this home.
Original Mortgage
$12,500
Interest Rate
7.64%
Mortgage Type
Seller Take Back
Create a Home Valuation Report for This Property
The Home Valuation Report is an in-depth analysis detailing your home's value as well as a comparison with similar homes in the area
Home Values in the Area
Average Home Value in this Area
Purchase History
| Date | Buyer | Sale Price | Title Company |
|---|---|---|---|
| Cobos Bernabe | -- | None Available | |
| Cobos Irene Evangelina Grado | -- | None Available | |
| Cobos Bernabe | -- | -- | |
| Cobos Ben | -- | -- |
Source: Public Records
Mortgage History
| Date | Status | Borrower | Loan Amount |
|---|---|---|---|
| Open | Cobos Bernabe | $50,291 | |
| Previous Owner | Cobos Ben | $12,500 |
Source: Public Records
Tax History Compared to Growth
Tax History
| Year | Tax Paid | Tax Assessment Tax Assessment Total Assessment is a certain percentage of the fair market value that is determined by local assessors to be the total taxable value of land and additions on the property. | Land | Improvement |
|---|---|---|---|---|
| 2025 | $1,777 | $163,811 | -- | -- |
| 2024 | $1,777 | $148,919 | -- | -- |
| 2023 | $1,690 | $135,381 | $0 | $0 |
| 2022 | $3,822 | $123,074 | $0 | $0 |
| 2021 | $3,637 | $117,075 | $14,102 | $102,973 |
| 2020 | $3,213 | $101,714 | $14,102 | $87,612 |
| 2018 | $3,403 | $109,555 | $16,408 | $93,147 |
| 2017 | $3,041 | $99,494 | $16,408 | $83,086 |
| 2016 | $3,041 | $99,494 | $16,408 | $83,086 |
| 2015 | $1,413 | $99,494 | $16,408 | $83,086 |
| 2014 | $1,413 | $101,141 | $16,408 | $84,733 |
Source: Public Records
Map
Nearby Homes
- 7622 Matamoros Dr
- 7761 Maverick Ave
- 7713 Matamoros Dr
- 7718 Parral Dr
- 7564 Matamoros Dr
- 7832 Ranchland Dr
- 7534 Taxco Dr
- 844 Santa Barbara Dr
- 1121 Belen Rd
- 812 Santa Barbara Dr
- 7542 Hermosillo Dr
- 7922 Parral Dr
- 7800 Hermosillo Dr
- 7655 Hacienda Ave
- 1207 Bois d Arc Dr
- 1124 Hunter Dr
- 7921 Candlewood Ave
- 740 Draco Place
- 7928 Hermosillo Dr
- 7936 Dogwood St
- 7728 Ranchland Dr
- 7720 Ranchland Dr
- 7621 Matamoros Dr
- 7619 Matamoros Dr
- 7623 Matamoros Dr
- 7725 Ranchland Dr
- 7625 Matamoros Dr
- 7736 Ranchland Dr
- 7736 Ranchland Dr Unit A
- 7733 Maverick Ave
- 7724 Mustang Ave
- 7712 Ranchland Dr
- 7627 Matamoros Dr
- 7728 Mustang Ave
- 7740 Ranchland Dr
- 7737 Maverick Ave
- 7732 Mustang Ave
- 7629 Matamoros Dr
- 7613 Matamoros Dr
- 7740 Maverick Ave