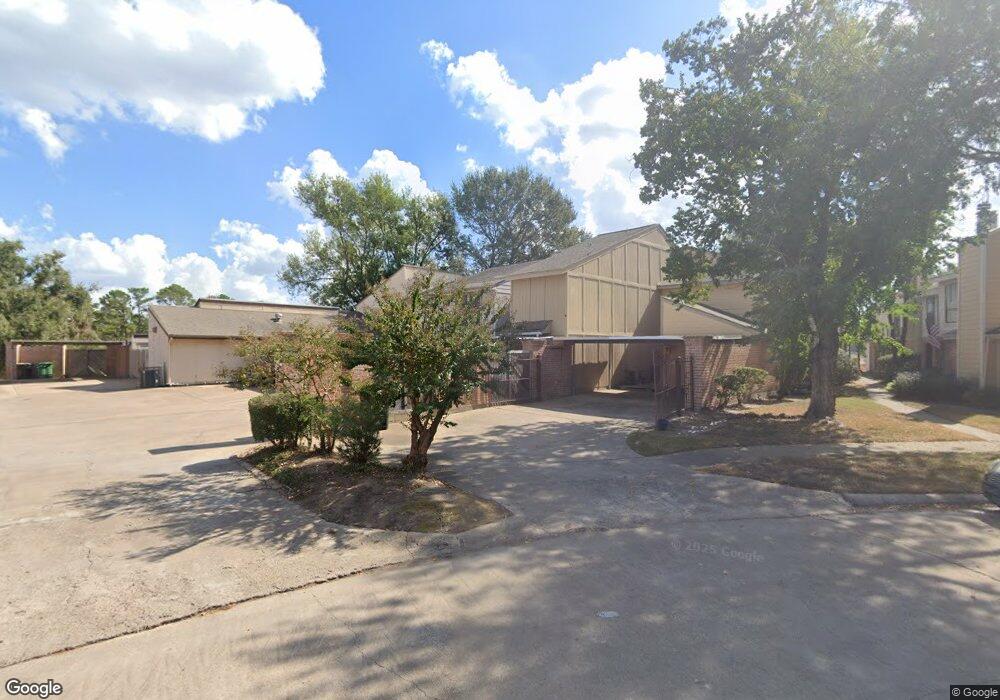
7726 Challie Ln Unit 7726 Houston, TX 77088
Greater Inwood NeighborhoodEstimated Value: $146,000 - $160,665
2
Beds
3
Baths
1,512
Sq Ft
$102/Sq Ft
Est. Value
About This Home
This home is located at 7726 Challie Ln Unit 7726, Houston, TX 77088 and is currently estimated at $153,666, approximately $101 per square foot. 7726 Challie Ln Unit 7726 is a home located in Harris County with nearby schools including Edward a Vines EC/Pre-K/K School, J. Ruth Smith Elementary, and Hoffman Middle School.
Ownership History
Date
Name
Owned For
Owner Type
Purchase Details
Closed on
Dec 16, 2015
Sold by
White Cevera
Bought by
White Anngennette
Current Estimated Value
Purchase Details
Closed on
Oct 15, 2004
Sold by
White Anngennette
Bought by
White Cevera L
Home Financials for this Owner
Home Financials are based on the most recent Mortgage that was taken out on this home.
Original Mortgage
$57,600
Outstanding Balance
$28,717
Interest Rate
5.87%
Mortgage Type
Stand Alone Refi Refinance Of Original Loan
Estimated Equity
$124,949
Purchase Details
Closed on
May 15, 1998
Sold by
Hyatt Dorothy A
Bought by
White Anngennette
Home Financials for this Owner
Home Financials are based on the most recent Mortgage that was taken out on this home.
Original Mortgage
$51,950
Interest Rate
7.18%
Mortgage Type
Purchase Money Mortgage
Create a Home Valuation Report for This Property
The Home Valuation Report is an in-depth analysis detailing your home's value as well as a comparison with similar homes in the area
Home Values in the Area
Average Home Value in this Area
Purchase History
| Date | Buyer | Sale Price | Title Company |
|---|---|---|---|
| White Anngennette | -- | None Available | |
| White Cevera L | -- | -- | |
| White Anngennette | -- | Texas American Title Company |
Source: Public Records
Mortgage History
| Date | Status | Borrower | Loan Amount |
|---|---|---|---|
| Open | White Cevera L | $57,600 | |
| Closed | White Anngennette | $51,950 | |
| Closed | White Cevera L | $14,400 |
Source: Public Records
Tax History Compared to Growth
Tax History
| Year | Tax Paid | Tax Assessment Tax Assessment Total Assessment is a certain percentage of the fair market value that is determined by local assessors to be the total taxable value of land and additions on the property. | Land | Improvement |
|---|---|---|---|---|
| 2025 | $1,682 | $145,950 | $29,165 | $116,785 |
| 2024 | $1,682 | $148,073 | $29,165 | $118,908 |
| 2023 | $1,682 | $148,073 | $29,165 | $118,908 |
| 2022 | $2,799 | $125,747 | $23,332 | $102,415 |
| 2021 | $2,658 | $101,702 | $11,666 | $90,036 |
| 2020 | $2,533 | $97,546 | $11,666 | $85,880 |
| 2019 | $2,403 | $84,276 | $11,666 | $72,610 |
| 2018 | $723 | $75,339 | $11,666 | $63,673 |
| 2017 | $1,927 | $70,271 | $11,666 | $58,605 |
| 2016 | $1,752 | $62,921 | $11,666 | $51,255 |
| 2015 | $1,625 | $62,921 | $11,666 | $51,255 |
| 2014 | $1,625 | $58,187 | $11,666 | $46,521 |
Source: Public Records
Map
Nearby Homes
- 7736 Challie Ln
- 7728 Challie Ln
- 7840 Bateman Ln Unit 7840
- 7750 Green Lawn Dr
- 7868 Green Lawn Dr Unit 7868
- 7727 Green Lawn Dr
- 0 Antoine Dr
- 5914 Lawn Ln
- 6011 Green Falls Dr
- 5906 Lawn Ln
- 5639 Council Grove Ln
- 5710 Council Grove Ln
- 5519 Council Grove Ln
- 7402 Alabonson Rd Unit 506
- 7402 Alabonson Rd Unit 309
- 7402 Alabonson Rd Unit 510
- 7402 Alabonson Rd Unit 108
- 5611 Water Leaf Ln
- 5606 Water Leaf Ln
- 6303 Greenway Forest Ln
- 7724 Challie Ln Unit 7724
- 7722 Challie Ln Unit 7740
- 7730 Challie Ln Unit 7730
- 7718 Challie Ln Unit 7718
- 7720 Challie Ln Unit 7720
- 7716 Challie Ln Unit 7716
- 7714 Challie Ln Unit 7714
- 7732 Challie Ln Unit 7732
- 7736 Challie Ln Unit 7736
- 7738 Challie Ln Unit 7738
- 7734 Challie Ln Unit 7734
- 7740 Challie Ln Unit 7740
- 7712 Challie Ln Unit 7712
- 7803 Challie Ln Unit 7803
- 7805 Challie Ln Unit 7805
- 7809 Challie Ln Unit 7809
- 7838 Challie Ln
- 7811 Challie Ln Unit 7811
- 7813 Challie Ln Unit 7813
- 7840 Challie Ln