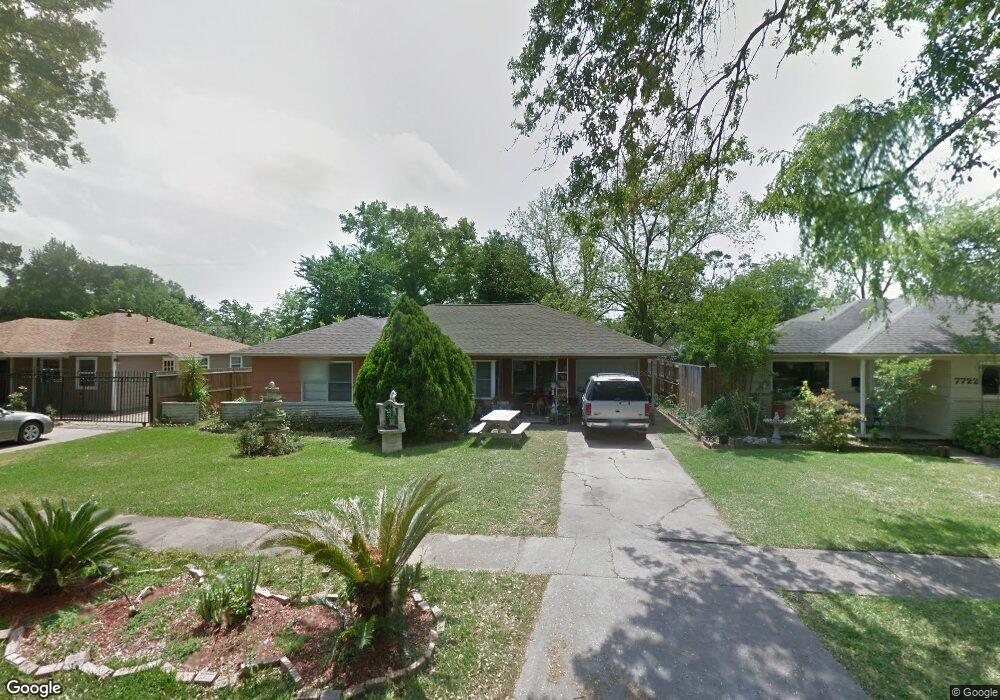
7726 Hereford St Houston, TX 77087
Golfcrest-Bellfort-Reveille NeighborhoodEstimated Value: $209,000 - $246,000
3
Beds
2
Baths
1,539
Sq Ft
$145/Sq Ft
Est. Value
About This Home
This home is located at 7726 Hereford St, Houston, TX 77087 and is currently estimated at $222,449, approximately $144 per square foot. 7726 Hereford St is a home located in Harris County with nearby schools including Cornelius Elementary School, Hartman Middle School, and Ross Shaw Sterling Aviation High School.
Ownership History
Date
Name
Owned For
Owner Type
Purchase Details
Closed on
May 21, 2003
Sold by
Citifinancial Mortgage Co Inc
Bought by
Pizano Lino and Fragoso Cecilia G
Current Estimated Value
Home Financials for this Owner
Home Financials are based on the most recent Mortgage that was taken out on this home.
Original Mortgage
$66,435
Outstanding Balance
$28,579
Interest Rate
5.65%
Mortgage Type
Purchase Money Mortgage
Estimated Equity
$193,870
Purchase Details
Closed on
Oct 1, 2002
Sold by
Marquez Miguel and Pena Maria
Bought by
Citifinancial Mtg Company Inc
Purchase Details
Closed on
Apr 12, 2000
Sold by
Molina Deny E and Molina Maria C
Bought by
Marquez Miguel and Pena Maria
Home Financials for this Owner
Home Financials are based on the most recent Mortgage that was taken out on this home.
Original Mortgage
$75,816
Interest Rate
8.27%
Purchase Details
Closed on
Dec 2, 1997
Sold by
Nutt John A and Nutt Kathryn
Bought by
Molina Deny R and Molina Maria C
Create a Home Valuation Report for This Property
The Home Valuation Report is an in-depth analysis detailing your home's value as well as a comparison with similar homes in the area
Home Values in the Area
Average Home Value in this Area
Purchase History
| Date | Buyer | Sale Price | Title Company |
|---|---|---|---|
| Pizano Lino | -- | Alamo Title Company | |
| Citifinancial Mtg Company Inc | $51,920 | -- | |
| Marquez Miguel | -- | Stewart Title | |
| Molina Deny R | -- | Stewart Title |
Source: Public Records
Mortgage History
| Date | Status | Borrower | Loan Amount |
|---|---|---|---|
| Open | Pizano Lino | $66,435 | |
| Previous Owner | Marquez Miguel | $75,816 | |
| Closed | Marquez Miguel | $8,400 |
Source: Public Records
Tax History Compared to Growth
Tax History
| Year | Tax Paid | Tax Assessment Tax Assessment Total Assessment is a certain percentage of the fair market value that is determined by local assessors to be the total taxable value of land and additions on the property. | Land | Improvement |
|---|---|---|---|---|
| 2025 | $9 | $178,907 | $48,300 | $130,607 |
| 2024 | $9 | $178,907 | $48,300 | $130,607 |
| 2023 | $9 | $176,421 | $48,300 | $128,121 |
| 2022 | $3,390 | $163,317 | $48,300 | $115,017 |
| 2021 | $3,054 | $135,609 | $27,600 | $108,009 |
| 2020 | $3,064 | $120,328 | $20,700 | $99,628 |
| 2019 | $2,903 | $108,360 | $20,700 | $87,660 |
| 2018 | $587 | $98,463 | $20,700 | $77,763 |
| 2017 | $2,637 | $98,463 | $20,700 | $77,763 |
| 2016 | $2,510 | $93,704 | $20,700 | $73,004 |
| 2015 | $1,621 | $93,704 | $20,700 | $73,004 |
| 2014 | $1,621 | $87,084 | $20,700 | $66,384 |
Source: Public Records
Map
Nearby Homes
- 7735 Oak Vista St
- 7734 El Rancho St
- 7758 Hereford St
- 7908 Grove Ridge Dr
- 7936 Grove Ridge Dr
- 7909 Dixie Dr
- 7837 Leonora St
- 7954 Grove Ridge Dr
- 7819 Leonora St
- 0 Dover St Unit 39828065
- 7802 Santa Elena St
- 7846 Santa Elena St
- 7486 Stanwick Dr
- 3731 Reveille St
- 8235 Dover St
- 7851 Pecan Villas Dr
- 8200 Broadway St Unit 311
- 8200 Broadway St Unit 133
- 8200 Broadway St
- 3743 Erie St
- 7722 Hereford St
- 7730 Hereford St
- 7718 Hereford St
- 7727 Oak Vista St
- 7731 Oak Vista St
- 7731 Oak Vista St
- 7734 Hereford St
- 7723 Oak Vista St
- 7735 Oak Vista St
- 7735 Oak Vista St Unit 1
- 7727 Hereford St
- 7723 Hereford St
- 7714 Hereford St
- 7719 Oak Vista St
- 7738 Hereford St
- 7739 Oak Vista St
- 7739 Oak Vista St
- 7731 Hereford St
- 7719 Hereford St
- 7719 Hereford St Unit B