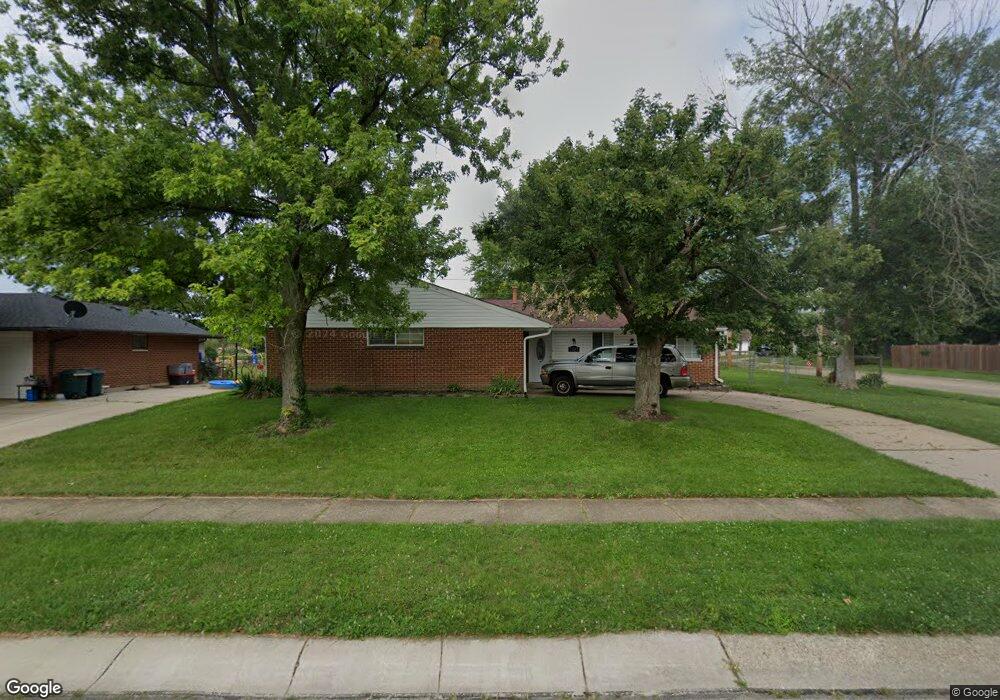
7727 Blackshear Dr Dayton, OH 45424
Estimated Value: $190,000 - $218,000
4
Beds
2
Baths
1,404
Sq Ft
$143/Sq Ft
Est. Value
About This Home
This home is located at 7727 Blackshear Dr, Dayton, OH 45424 and is currently estimated at $201,086, approximately $143 per square foot. 7727 Blackshear Dr is a home located in Montgomery County with nearby schools including Wayne High School and Huber Heights Christian Academy.
Ownership History
Date
Name
Owned For
Owner Type
Purchase Details
Closed on
Jun 24, 2019
Sold by
Ogletree Enterprises Llc
Bought by
Gooding Santez
Current Estimated Value
Home Financials for this Owner
Home Financials are based on the most recent Mortgage that was taken out on this home.
Original Mortgage
$113,898
Outstanding Balance
$101,542
Interest Rate
5.12%
Mortgage Type
FHA
Estimated Equity
$99,544
Purchase Details
Closed on
Mar 16, 2018
Sold by
York Property Management Inc
Bought by
Ogletree Enterprises
Purchase Details
Closed on
Nov 19, 2008
Sold by
Sacco Robert R
Bought by
York Property Management Inc
Purchase Details
Closed on
Dec 15, 2006
Sold by
Parmenter Connie B and Foor Connie B
Bought by
Sacco Robert R and Robert R Sacco Trust
Purchase Details
Closed on
Nov 25, 2003
Sold by
Foor David C
Bought by
Foor Connie B
Create a Home Valuation Report for This Property
The Home Valuation Report is an in-depth analysis detailing your home's value as well as a comparison with similar homes in the area
Home Values in the Area
Average Home Value in this Area
Purchase History
| Date | Buyer | Sale Price | Title Company |
|---|---|---|---|
| Gooding Santez | $116,000 | Sterling Land Title Agcy Inc | |
| Ogletree Enterprises | $65,000 | Sterling Land Title Agency | |
| York Property Management Inc | $91,900 | Attorney | |
| Sacco Robert R | $90,700 | Attorney | |
| Foor Connie B | -- | -- |
Source: Public Records
Mortgage History
| Date | Status | Borrower | Loan Amount |
|---|---|---|---|
| Open | Gooding Santez | $113,898 |
Source: Public Records
Tax History
| Year | Tax Paid | Tax Assessment Tax Assessment Total Assessment is a certain percentage of the fair market value that is determined by local assessors to be the total taxable value of land and additions on the property. | Land | Improvement |
|---|---|---|---|---|
| 2025 | $2,910 | $53,220 | $10,150 | $43,070 |
| 2024 | $2,813 | $53,220 | $10,150 | $43,070 |
| 2023 | $2,813 | $53,220 | $10,150 | $43,070 |
| 2022 | $2,460 | $36,660 | $7,000 | $29,660 |
| 2021 | $2,494 | $36,660 | $7,000 | $29,660 |
| 2020 | $2,496 | $36,660 | $7,000 | $29,660 |
| 2019 | $2,265 | $29,370 | $7,000 | $22,370 |
| 2018 | $2,273 | $29,370 | $7,000 | $22,370 |
| 2017 | $2,259 | $29,370 | $7,000 | $22,370 |
| 2016 | $2,085 | $27,100 | $7,000 | $20,100 |
| 2015 | $2,058 | $27,100 | $7,000 | $20,100 |
| 2014 | $2,058 | $27,100 | $7,000 | $20,100 |
| 2012 | -- | $29,630 | $8,750 | $20,880 |
Source: Public Records
Map
Nearby Homes
- 7505 Mount Ranier Unit 12117
- 7882 Harshmanville Rd
- 7999 Blackshear Dr
- 7431 Troy Manor Rd
- 6483 Highbury Rd
- 7356 Natoma Place
- 7371 Damascus Dr
- 6324 Larcomb Dr
- 7259 Charnwood Dr
- 6358 Greenfield Way
- 6529 Larcomb Dr
- 8286 Briar Ridge Ct
- 7069 Harshmanville Rd
- 6065 Shull Rd
- 7214 Citadel Dr
- 6601 Grovehill Dr
- 6857 Pablo Dr
- 6533 Millhoff Dr
- 6334 Shull Rd
- 5917 Longford Rd
- 7721 Blackshear Dr
- 5978 Corby Way
- 7741 Blackshear Dr
- 7715 Blackshear Dr
- 7730 Blackshear Dr
- 5970 Corby Way
- 7724 Blackshear Dr
- 7736 Blackshear Dr
- 7718 Blackshear Dr
- 7747 Blackshear Dr
- 8138 Mount Hood
- 7709 Blackshear Dr
- 7742 Blackshear Dr
- 7712 Blackshear Dr
- 8128 Mount Hood
- 8146 Mount Hood
- 7731 Harshmanville Rd
- 7725 Harshmanville Rd
- 7737 Harshmanville Rd
- 7753 Blackshear Dr
Your Personal Tour Guide
Ask me questions while you tour the home.