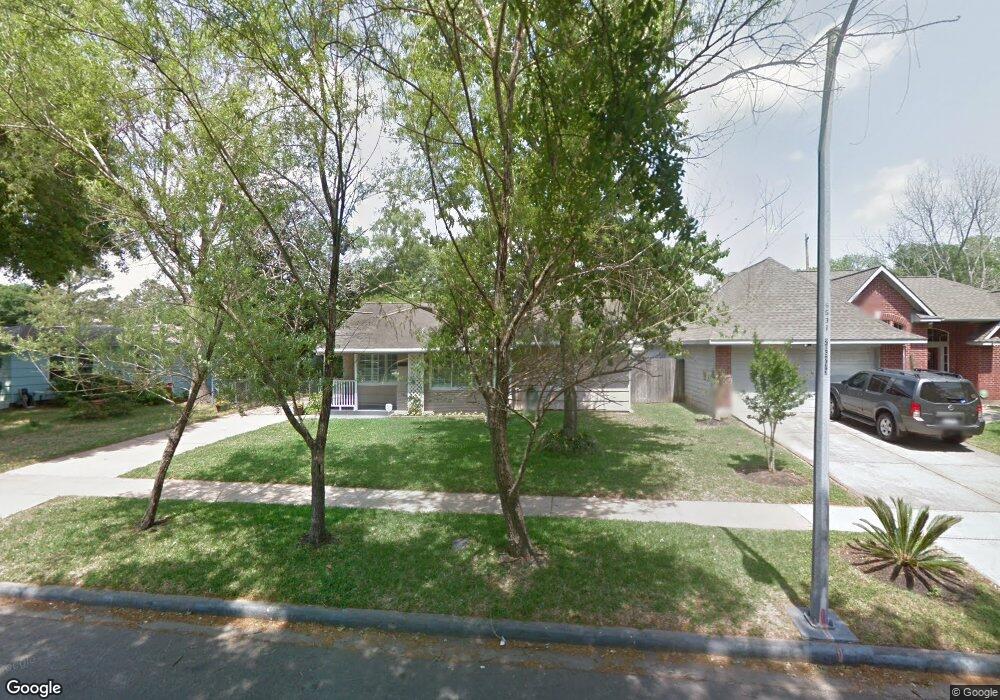
7727 Hereford St Houston, TX 77087
Golfcrest-Bellfort-Reveille NeighborhoodEstimated Value: $182,113 - $215,000
3
Beds
1
Bath
1,237
Sq Ft
$161/Sq Ft
Est. Value
About This Home
This home is located at 7727 Hereford St, Houston, TX 77087 and is currently estimated at $198,778, approximately $160 per square foot. 7727 Hereford St is a home located in Harris County with nearby schools including Cornelius Elementary School, Hartman Middle School, and Ross Shaw Sterling Aviation High School.
Ownership History
Date
Name
Owned For
Owner Type
Purchase Details
Closed on
Feb 9, 2009
Sold by
Stephens Sherry L
Bought by
Flores Sergio Carlos
Current Estimated Value
Home Financials for this Owner
Home Financials are based on the most recent Mortgage that was taken out on this home.
Original Mortgage
$96,531
Outstanding Balance
$60,624
Interest Rate
5.06%
Mortgage Type
VA
Estimated Equity
$138,154
Purchase Details
Closed on
Nov 25, 1998
Sold by
Dillahunty Cyd C
Bought by
Stephens Sherry L
Home Financials for this Owner
Home Financials are based on the most recent Mortgage that was taken out on this home.
Original Mortgage
$53,600
Interest Rate
6.69%
Purchase Details
Closed on
Jul 1, 1998
Sold by
Stanley Marc Aaron
Bought by
Dillahunty Cyd
Purchase Details
Closed on
Oct 7, 1994
Sold by
Grimes Richard M and Grimes Deborah D
Bought by
Stanley Marc
Create a Home Valuation Report for This Property
The Home Valuation Report is an in-depth analysis detailing your home's value as well as a comparison with similar homes in the area
Home Values in the Area
Average Home Value in this Area
Purchase History
| Date | Buyer | Sale Price | Title Company |
|---|---|---|---|
| Flores Sergio Carlos | -- | Texas American Title Company | |
| Stephens Sherry L | -- | -- | |
| Dillahunty Cyd | -- | American Title Company | |
| Stanley Marc | -- | Title Agency #26 |
Source: Public Records
Mortgage History
| Date | Status | Borrower | Loan Amount |
|---|---|---|---|
| Open | Flores Sergio Carlos | $96,531 | |
| Previous Owner | Stephens Sherry L | $53,600 |
Source: Public Records
Tax History Compared to Growth
Tax History
| Year | Tax Paid | Tax Assessment Tax Assessment Total Assessment is a certain percentage of the fair market value that is determined by local assessors to be the total taxable value of land and additions on the property. | Land | Improvement |
|---|---|---|---|---|
| 2025 | $1,773 | $157,540 | $47,163 | $110,377 |
| 2024 | $1,773 | $157,540 | $47,163 | $110,377 |
| 2023 | $1,773 | $155,510 | $47,163 | $108,347 |
| 2022 | $3,089 | $144,680 | $47,163 | $97,517 |
| 2021 | $2,783 | $119,388 | $26,950 | $92,438 |
| 2020 | $2,794 | $108,850 | $20,213 | $88,637 |
| 2019 | $2,648 | $98,788 | $20,213 | $78,575 |
| 2018 | $1,537 | $90,365 | $20,213 | $70,152 |
| 2017 | $2,420 | $90,365 | $20,213 | $70,152 |
| 2016 | $2,326 | $86,832 | $20,213 | $66,619 |
| 2015 | $1,502 | $86,832 | $20,213 | $66,619 |
| 2014 | $1,502 | $81,354 | $20,213 | $61,141 |
Source: Public Records
Map
Nearby Homes
- 7734 El Rancho St
- 7735 Oak Vista St
- 7758 Hereford St
- 7909 Dixie Dr
- 7908 Grove Ridge Dr
- 7936 Grove Ridge Dr
- 7837 Leonora St
- 7954 Grove Ridge Dr
- 7819 Leonora St
- 0 Dover St Unit 39828065
- 7802 Santa Elena St
- 3731 Reveille St
- 7486 Stanwick Dr
- 7846 Santa Elena St
- 3743 Erie St
- 8235 Dover St
- 3607 De Leon St
- 7851 Pecan Villas Dr
- 8200 Broadway St Unit 311
- 8200 Broadway St Unit 133
- 7731 Hereford St
- 7723 Hereford St
- 7726 El Rancho St
- 7735 Hereford St
- 7730 El Rancho St
- 7719 Hereford St
- 7719 Hereford St Unit B
- 7722 El Rancho St
- 7718 El Rancho St
- 7739 Hereford St
- 7726 Hereford St
- 7730 Hereford St
- 7715 Hereford St
- 7722 Hereford St
- 7734 Hereford St
- 7738 El Rancho St
- 7714 El Rancho St
- 7718 Hereford St
- 7738 Hereford St
- 7743 Hereford St