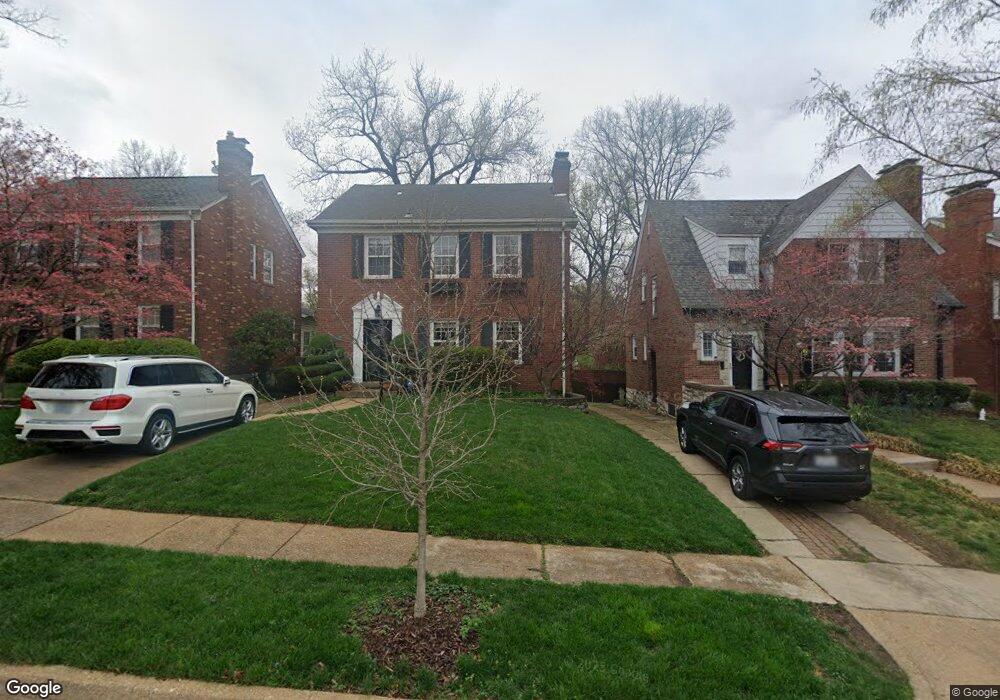
7727 Stanford Ave Saint Louis, MO 63130
Estimated Value: $435,285 - $558,000
3
Beds
2
Baths
1,647
Sq Ft
$299/Sq Ft
Est. Value
About This Home
This home is located at 7727 Stanford Ave, Saint Louis, MO 63130 and is currently estimated at $491,821, approximately $298 per square foot. 7727 Stanford Ave is a home located in St. Louis County with nearby schools including Jackson Park Elementary School, Brittany Woods Middle School, and University City High School.
Ownership History
Date
Name
Owned For
Owner Type
Purchase Details
Closed on
Jul 26, 2017
Sold by
Krusemark Jennifer L
Bought by
Krusemark Jennifer L and Jennifer L Krusemark Trust
Current Estimated Value
Purchase Details
Closed on
Sep 11, 2012
Sold by
Mellinger Michael J and Mellinger Donna K
Bought by
Krusemark Jennifer L
Home Financials for this Owner
Home Financials are based on the most recent Mortgage that was taken out on this home.
Original Mortgage
$173,000
Outstanding Balance
$119,822
Interest Rate
3.59%
Mortgage Type
New Conventional
Estimated Equity
$371,999
Purchase Details
Closed on
Jul 29, 1998
Sold by
Sutton Thomas L and Sutton Judith S
Bought by
Kopf Donna A
Home Financials for this Owner
Home Financials are based on the most recent Mortgage that was taken out on this home.
Original Mortgage
$125,000
Interest Rate
6.94%
Create a Home Valuation Report for This Property
The Home Valuation Report is an in-depth analysis detailing your home's value as well as a comparison with similar homes in the area
Home Values in the Area
Average Home Value in this Area
Purchase History
| Date | Buyer | Sale Price | Title Company |
|---|---|---|---|
| Krusemark Jennifer L | -- | None Available | |
| Krusemark Jennifer L | $258,000 | Investors Title Co Clayton | |
| Kopf Donna A | -- | -- |
Source: Public Records
Mortgage History
| Date | Status | Borrower | Loan Amount |
|---|---|---|---|
| Open | Krusemark Jennifer L | $173,000 | |
| Previous Owner | Kopf Donna A | $125,000 |
Source: Public Records
Tax History Compared to Growth
Tax History
| Year | Tax Paid | Tax Assessment Tax Assessment Total Assessment is a certain percentage of the fair market value that is determined by local assessors to be the total taxable value of land and additions on the property. | Land | Improvement |
|---|---|---|---|---|
| 2025 | $4,935 | $77,750 | $47,840 | $29,910 |
| 2024 | $4,935 | $69,350 | $43,050 | $26,300 |
| 2023 | $4,929 | $69,350 | $43,050 | $26,300 |
| 2022 | $5,035 | $66,030 | $38,270 | $27,760 |
| 2021 | $4,983 | $66,030 | $38,270 | $27,760 |
| 2020 | $4,930 | $63,650 | $37,790 | $25,860 |
| 2019 | $4,883 | $63,650 | $37,790 | $25,860 |
| 2018 | $4,304 | $51,820 | $24,740 | $27,080 |
| 2017 | $4,313 | $51,820 | $24,740 | $27,080 |
| 2016 | $4,900 | $56,430 | $21,980 | $34,450 |
| 2015 | $4,921 | $56,430 | $21,980 | $34,450 |
| 2014 | $4,788 | $53,960 | $14,290 | $39,670 |
Source: Public Records
Map
Nearby Homes
- 846 Wild Cherry Ln
- 7823 Stanford Ave
- 7584 Amherst Ave
- 7812 Cornell Ave
- 7843 Cornell Ave
- 7814 Gannon Ave
- 7835 Delmar Blvd Unit 1E, 1W, 2E, 2W
- 7634 Balson Ave
- 7723 Wild Plum Ln
- 516 Warder Ave
- 500 N and Rd S Unit 103
- 946 Abbeville Dr
- 7484 Gannon Ave
- 515 N Bemiston Ave
- 1059 N and South Rd
- 7830 Lafon Place
- 7510 Teasdale Ave
- 7526 Washington Ave
- 7498 Teasdale Ave
- 7459 Washington Ave
- 7731 Stanford Ave
- 7725 Stanford Ave
- 7733 Stanford Ave
- 7721 Stanford Ave
- 7739 Stanford Ave
- 7719 Stanford Ave
- 7730 Balson Ave
- 7724 Balson Ave
- 7715 Stanford Ave
- 7743 Stanford Ave
- 7718 Amherst Ave
- 7726 Stanford Ave
- 7740 Balson Ave
- 7722 Stanford Ave
- 7730 Stanford Ave
- 7720 Stanford Ave
- 7732 Stanford Ave
- 7745 Stanford Ave
- 7709 Stanford Ave
- 7712 Amherst Ave