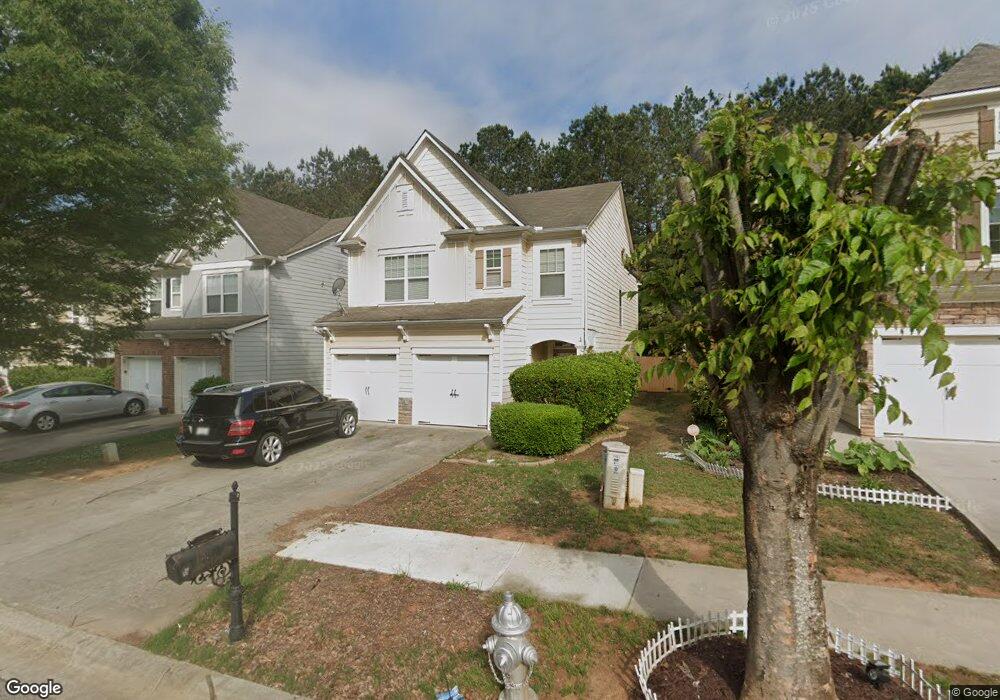
7729 Bellmist Dr Unit 3 Fairburn, GA 30213
Estimated Value: $279,000 - $298,000
3
Beds
3
Baths
1,808
Sq Ft
$158/Sq Ft
Est. Value
About This Home
This home is located at 7729 Bellmist Dr Unit 3, Fairburn, GA 30213 and is currently estimated at $286,302, approximately $158 per square foot. 7729 Bellmist Dr Unit 3 is a home located in Fulton County with nearby schools including Renaissance Elementary School, Renaissance Middle School, and Langston Hughes High School.
Ownership History
Date
Name
Owned For
Owner Type
Purchase Details
Closed on
Mar 12, 2020
Sold by
Alto Asset Co 2 Llc
Bought by
Alto Asset Co 2 Llc
Current Estimated Value
Purchase Details
Closed on
Mar 3, 2020
Sold by
Mupr 3 Assets Llc
Bought by
Alto Asset Co 2 Llc
Purchase Details
Closed on
Oct 8, 2019
Sold by
Levister Joshalyn
Bought by
Mupr 3 Assets Llc
Purchase Details
Closed on
Jun 18, 2008
Sold by
Federal Home Loan Mortgage Corporation
Bought by
Levister Joshalyn
Home Financials for this Owner
Home Financials are based on the most recent Mortgage that was taken out on this home.
Original Mortgage
$116,176
Interest Rate
5.97%
Mortgage Type
FHA
Purchase Details
Closed on
Jan 2, 2008
Sold by
Aurora Loan Services Llc
Bought by
Federal Home Loan Mortgage Corporation
Create a Home Valuation Report for This Property
The Home Valuation Report is an in-depth analysis detailing your home's value as well as a comparison with similar homes in the area
Home Values in the Area
Average Home Value in this Area
Purchase History
| Date | Buyer | Sale Price | Title Company |
|---|---|---|---|
| Alto Asset Co 2 Llc | -- | -- | |
| Alto Asset Co 2 Llc | $178,298 | -- | |
| Mupr 3 Assets Llc | $154,000 | -- | |
| Levister Joshalyn | -- | -- | |
| Federal Home Loan Mortgage Corporation | -- | -- | |
| Aurora Loan Services Llc | $140,378 | -- |
Source: Public Records
Mortgage History
| Date | Status | Borrower | Loan Amount |
|---|---|---|---|
| Previous Owner | Levister Joshalyn | $116,176 |
Source: Public Records
Tax History Compared to Growth
Tax History
| Year | Tax Paid | Tax Assessment Tax Assessment Total Assessment is a certain percentage of the fair market value that is determined by local assessors to be the total taxable value of land and additions on the property. | Land | Improvement |
|---|---|---|---|---|
| 2025 | $4,314 | $112,000 | $27,760 | $84,240 |
| 2023 | $4,314 | $112,000 | $27,760 | $84,240 |
| 2022 | $3,571 | $91,080 | $17,240 | $73,840 |
| 2021 | $2,466 | $72,840 | $15,640 | $57,200 |
| 2020 | $2,507 | $61,600 | $13,160 | $48,440 |
| 2019 | $1,072 | $60,120 | $11,920 | $48,200 |
| 2018 | $1,351 | $54,680 | $11,600 | $43,080 |
| 2017 | $675 | $33,640 | $6,920 | $26,720 |
| 2016 | $673 | $33,640 | $6,920 | $26,720 |
| 2015 | $676 | $33,640 | $6,920 | $26,720 |
| 2014 | $686 | $33,640 | $6,920 | $26,720 |
Source: Public Records
Map
Nearby Homes
- 115 Emberwood Ln
- 6066 Allpoint Way Unit 3
- 7630 Cedar Grove Rd
- 6139 Allpoint Way
- 5915 Landers Loop
- 539 Greyhawk Way
- 6329 Edgewater Cove
- 7580 The Lakes Dr Unit 1
- 7553 The Lakes Dr
- 700 Kirkly Way
- 535 Lakeside View
- 455 Lakeside View
- 8004 Larksview Dr
- 5725 Cedar Pass
- 5745 Village Loop
- 8030 Snapwell Dr
- 7981 Gossamer Dr
- 6358 Foggy Oak Dr Unit 5
- 7729 Bellmist Dr
- 7729 Bellmist Dr
- 7733 Bellmist Dr
- 7725 Bellmist Dr Unit 3
- 7737 Bellmist Dr
- 7721 Bellmist Dr Unit 3
- 7741 Bellmist Dr
- 7717 Bellmist Dr
- 7713 Bellmist Dr
- 7790 Cedar Grove Rd
- 0 Bellmist Dr Unit 7132410
- 0 Bellmist Dr Unit 7067420
- 0 Bellmist Dr Unit 8531812
- 0 Bellmist Dr Unit 8500713
- 0 Bellmist Dr Unit 8144486
- 0 Bellmist Dr Unit 8029505
- 0 Bellmist Dr Unit 7538522
- 0 Bellmist Dr Unit 8707768
- 0 Bellmist Dr Unit 8698167
- 0 Bellmist Dr Unit 7035562