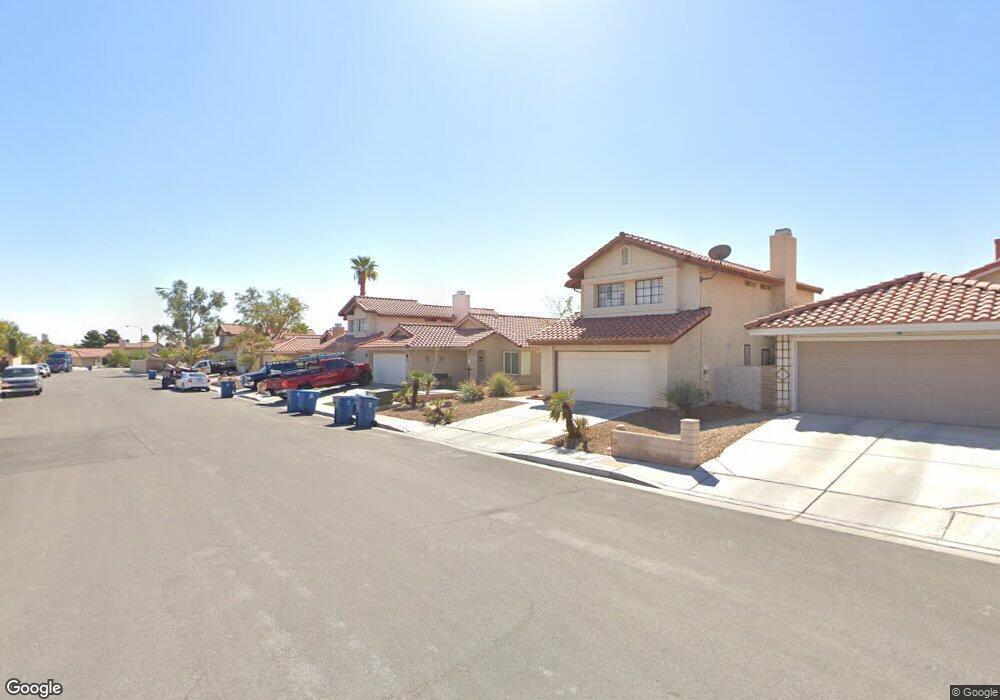
7729 Marmot Ave Unit 3G Las Vegas, NV 89147
Estimated Value: $270,000 - $387,000
3
Beds
2
Baths
1,212
Sq Ft
$285/Sq Ft
Est. Value
About This Home
This home is located at 7729 Marmot Ave Unit 3G, Las Vegas, NV 89147 and is currently estimated at $345,058, approximately $284 per square foot. 7729 Marmot Ave Unit 3G is a home located in Clark County with nearby schools including Frank Kim Elementary School, Clifford J Lawrence Junior High School, and Durango High School.
Ownership History
Date
Name
Owned For
Owner Type
Purchase Details
Closed on
Jun 9, 2021
Sold by
Lyle And Heide Bradley Rental Llc
Bought by
Cruz Jose A Serpa and Cruz Olga
Current Estimated Value
Home Financials for this Owner
Home Financials are based on the most recent Mortgage that was taken out on this home.
Original Mortgage
$208,160
Outstanding Balance
$188,463
Interest Rate
2.9%
Mortgage Type
FHA
Estimated Equity
$156,595
Purchase Details
Closed on
Jul 22, 2014
Sold by
Bradley Lyle B and Bradley Heide L
Bought by
Lyle & Heide Bradley Rental Llc
Purchase Details
Closed on
Sep 22, 2011
Sold by
Wells Fargo Bank N A
Bought by
Bradley Lyle B and Bradley Heide L
Purchase Details
Closed on
Aug 12, 2011
Sold by
Premvaree Jeerasak and Premvaree Wonnaporn
Bought by
Wells Fargo Bank Na
Create a Home Valuation Report for This Property
The Home Valuation Report is an in-depth analysis detailing your home's value as well as a comparison with similar homes in the area
Home Values in the Area
Average Home Value in this Area
Purchase History
| Date | Buyer | Sale Price | Title Company |
|---|---|---|---|
| Cruz Jose A Serpa | $212,000 | First American Title Insu | |
| Lyle & Heide Bradley Rental Llc | -- | None Available | |
| Bradley Lyle B | $85,000 | Ticor Title Las Vegas | |
| Wells Fargo Bank Na | $92,751 | Accommodation |
Source: Public Records
Mortgage History
| Date | Status | Borrower | Loan Amount |
|---|---|---|---|
| Open | Cruz Jose A Serpa | $208,160 |
Source: Public Records
Tax History Compared to Growth
Tax History
| Year | Tax Paid | Tax Assessment Tax Assessment Total Assessment is a certain percentage of the fair market value that is determined by local assessors to be the total taxable value of land and additions on the property. | Land | Improvement |
|---|---|---|---|---|
| 2025 | $1,901 | $71,125 | $30,800 | $40,325 |
| 2024 | $1,761 | $71,125 | $30,800 | $40,325 |
| 2023 | $1,172 | $67,157 | $28,350 | $38,807 |
| 2022 | $1,631 | $59,899 | $24,150 | $35,749 |
| 2021 | $1,510 | $55,938 | $21,700 | $34,238 |
| 2020 | $1,399 | $54,434 | $20,300 | $34,134 |
| 2019 | $1,311 | $52,102 | $18,200 | $33,902 |
| 2018 | $1,251 | $47,992 | $15,050 | $32,942 |
| 2017 | $1,406 | $47,951 | $14,350 | $33,601 |
| 2016 | $1,172 | $45,552 | $11,550 | $34,002 |
| 2015 | $1,169 | $42,153 | $8,400 | $33,753 |
| 2014 | $1,133 | $37,473 | $7,700 | $29,773 |
Source: Public Records
Map
Nearby Homes
- 4580 Allenford Dr
- 7777 Barbican Ct
- 4595 Grindle Point St
- 7822 Whitlocks Mill Ave
- 4658 Cosley Dr
- 7547 Kalmalii Ave
- 4725 Cosley Dr
- 7869 Barntucket Ave
- 7729 Rathburn Ave
- 7742 Selby Ct
- 4732 Illustrious St
- 4727 Siegfried St
- 7932 Barntucket Ave
- 4829 Farlington Dr Unit 3B
- 7544 Shangri la Ave
- 4502 New Dupell Way
- 7936 Canto Ave
- 4484 Warbonnet Way
- 7924 Bridgefield Ln
- 7507 Mycroft Ct
- 7719 Marmot Ave
- 7739 Marmot Ave
- 7709 Marmot Ave
- 7749 Marmot Ave
- 7749 Marmot Ave Unit n/a
- 7718 Barbican Ct
- 7728 Barbican Ct
- 7738 Barbican Ct
- 7708 Barbican Ct Unit 3E
- 4604 Allenford Dr
- 7699 Marmot Ave
- 7759 Marmot Ave Unit 3G
- 4605 Ermine Ct
- 7748 Barbican Ct
- 7698 Barbican Ct
- 7758 Barbican Ct
- 4598 Allenford Dr
- 7769 Marmot Ave
- 7689 Marmot Ave
- 4599 Ermine Ct