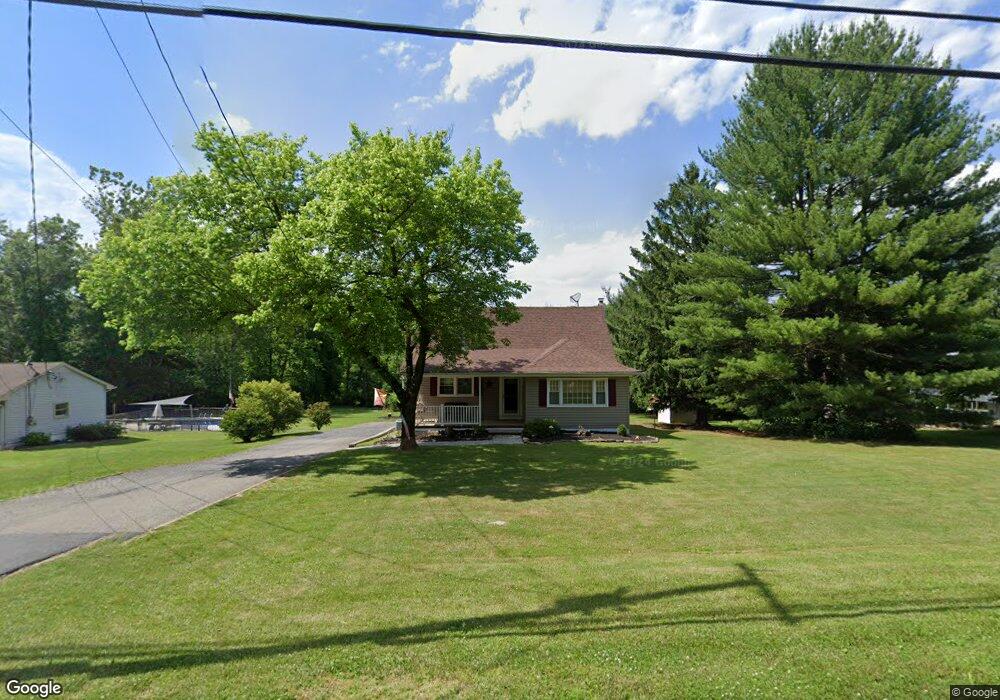
773 Amwell Rd Hillsborough, NJ 08844
Estimated Value: $500,000 - $617,000
--
Bed
--
Bath
1,604
Sq Ft
$354/Sq Ft
Est. Value
About This Home
This home is located at 773 Amwell Rd, Hillsborough, NJ 08844 and is currently estimated at $567,750, approximately $353 per square foot. 773 Amwell Rd is a home located in Somerset County with nearby schools including Hillsborough High School and Cherry Blossom Montessori School.
Ownership History
Date
Name
Owned For
Owner Type
Purchase Details
Closed on
Aug 4, 2003
Sold by
Conover Charles D
Bought by
Spinelli Michael and Spinelli Dawn
Current Estimated Value
Home Financials for this Owner
Home Financials are based on the most recent Mortgage that was taken out on this home.
Original Mortgage
$244,000
Outstanding Balance
$106,195
Interest Rate
5.46%
Mortgage Type
Purchase Money Mortgage
Estimated Equity
$461,555
Purchase Details
Closed on
Apr 26, 1993
Sold by
Schmeling Susan H and Schmeling Lowe,Chas
Bought by
Conover Chas D and Conover Susan F
Purchase Details
Closed on
Jul 1, 1988
Sold by
Schmeling Walter M and Schmeling Susan H
Bought by
Schmeling Susan H
Create a Home Valuation Report for This Property
The Home Valuation Report is an in-depth analysis detailing your home's value as well as a comparison with similar homes in the area
Home Values in the Area
Average Home Value in this Area
Purchase History
| Date | Buyer | Sale Price | Title Company |
|---|---|---|---|
| Spinelli Michael | $305,000 | -- | |
| Conover Chas D | $174,000 | -- | |
| Schmeling Susan H | -- | -- |
Source: Public Records
Mortgage History
| Date | Status | Borrower | Loan Amount |
|---|---|---|---|
| Open | Spinelli Michael | $244,000 |
Source: Public Records
Tax History Compared to Growth
Tax History
| Year | Tax Paid | Tax Assessment Tax Assessment Total Assessment is a certain percentage of the fair market value that is determined by local assessors to be the total taxable value of land and additions on the property. | Land | Improvement |
|---|---|---|---|---|
| 2025 | $9,080 | $467,900 | $228,000 | $239,900 |
| 2024 | $9,080 | $423,700 | $218,000 | $205,700 |
| 2023 | $8,289 | $385,000 | $178,000 | $207,000 |
| 2022 | $8,083 | $362,000 | $163,000 | $199,000 |
| 2021 | $8,075 | $343,900 | $153,000 | $190,900 |
| 2020 | $7,903 | $331,500 | $153,000 | $178,500 |
| 2019 | $7,488 | $311,500 | $133,000 | $178,500 |
| 2018 | $7,509 | $310,400 | $128,000 | $182,400 |
| 2017 | $7,583 | $314,000 | $128,000 | $186,000 |
| 2016 | $7,524 | $311,700 | $123,000 | $188,700 |
| 2015 | $6,644 | $278,700 | $123,000 | $155,700 |
| 2014 | $7,396 | $316,900 | $123,000 | $193,900 |
Source: Public Records
Map
Nearby Homes
- 752 Amwell Rd
- 581 Montgomery Rd
- 34 Lehigh Rd
- 407 Olive St
- 872 Amwell Rd
- 91 Briar Way
- 623 Montgomery Rd
- 372 Zion Rd
- 205 Hockenbury Rd
- 373 Zion Rd
- 68 Clover Hill Rd
- 5 Rea Ct
- 718 Mill Ln
- 64 Murray Dr
- 247 Summer Rd
- 200 Milkweed Ct Unit 200
- 816 Rt 202
- 21 Owl Ct Unit 21
- 12 Forest Hill Dr
- 300 E Mountain Rd