Estimated Value: $60,000 - $208,000
4
Beds
2
Baths
1,988
Sq Ft
$76/Sq Ft
Est. Value
About This Home
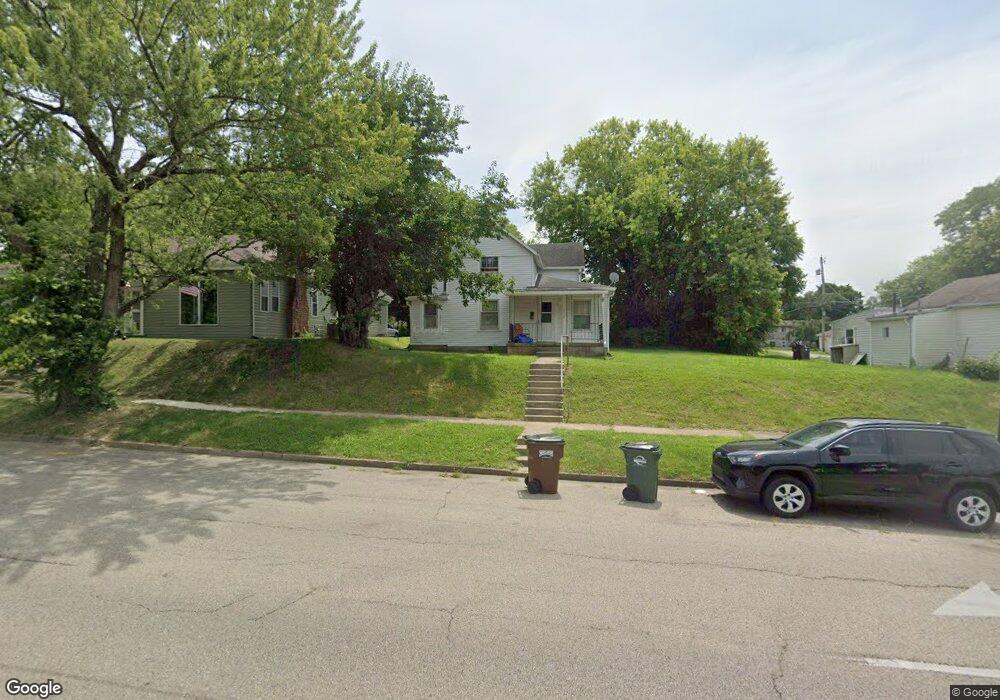
This home is located at 773 E Main St, Xenia, OH 45385 and is currently estimated at $150,684, approximately $75 per square foot. 773 E Main St is a home located in Greene County with nearby schools including Xenia High School, Summit Academy Community School for Alternative Learners - Xenia, and Legacy Christian Academy.
Ownership History
Date
Name
Owned For
Owner Type
Purchase Details
Closed on
May 24, 2006
Sold by
Estate Of Elmer L Harris
Bought by
Ames John T
Current Estimated Value
Home Financials for this Owner
Home Financials are based on the most recent Mortgage that was taken out on this home.
Original Mortgage
$25,200
Outstanding Balance
$14,711
Interest Rate
6.54%
Mortgage Type
Fannie Mae Freddie Mac
Estimated Equity
$135,973
Purchase Details
Closed on
Apr 26, 2006
Sold by
Harris Elmer L and Ames John T
Bought by
Ames Jaret T
Home Financials for this Owner
Home Financials are based on the most recent Mortgage that was taken out on this home.
Original Mortgage
$25,200
Outstanding Balance
$14,711
Interest Rate
6.54%
Mortgage Type
Fannie Mae Freddie Mac
Estimated Equity
$135,973
Purchase Details
Closed on
Jun 18, 2004
Sold by
Estate Of Elmer L Harris
Bought by
Ames John T
Create a Home Valuation Report for This Property
The Home Valuation Report is an in-depth analysis detailing your home's value as well as a comparison with similar homes in the area
Home Values in the Area
Average Home Value in this Area
Purchase History
| Date | Buyer | Sale Price | Title Company |
|---|---|---|---|
| Ames John T | -- | None Available | |
| Ames Jaret T | $28,000 | None Available | |
| Ames John T | -- | -- |
Source: Public Records
Mortgage History
| Date | Status | Borrower | Loan Amount |
|---|---|---|---|
| Open | Ames Jaret T | $25,200 |
Source: Public Records
Tax History Compared to Growth
Tax History
| Year | Tax Paid | Tax Assessment Tax Assessment Total Assessment is a certain percentage of the fair market value that is determined by local assessors to be the total taxable value of land and additions on the property. | Land | Improvement |
|---|---|---|---|---|
| 2024 | $1,088 | $25,430 | $2,150 | $23,280 |
| 2023 | $1,088 | $25,430 | $2,150 | $23,280 |
| 2022 | $906 | $18,050 | $1,950 | $16,100 |
| 2021 | $918 | $18,050 | $1,950 | $16,100 |
| 2020 | $879 | $18,050 | $1,950 | $16,100 |
| 2019 | $810 | $15,660 | $2,080 | $13,580 |
| 2018 | $814 | $15,660 | $2,080 | $13,580 |
| 2017 | $796 | $15,660 | $2,080 | $13,580 |
| 2016 | $796 | $15,040 | $2,080 | $12,960 |
| 2015 | $798 | $15,040 | $2,080 | $12,960 |
| 2014 | $764 | $15,040 | $2,080 | $12,960 |
Source: Public Records
Map
Nearby Homes