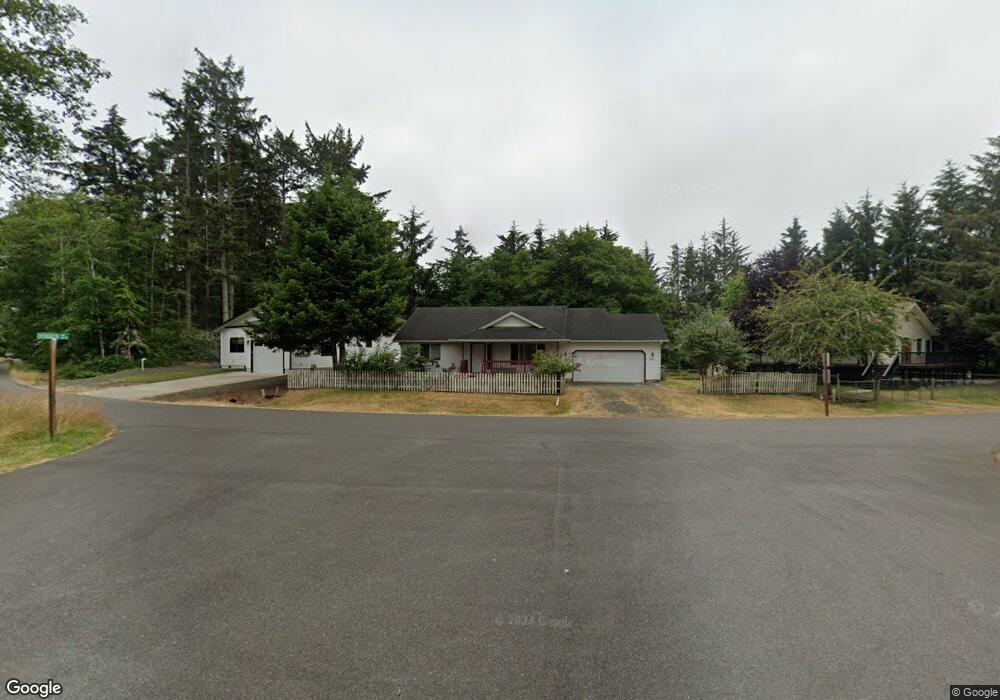
773 Evergreen Ct SW Ocean Shores, WA 98569
Estimated Value: $349,000 - $399,000
3
Beds
2
Baths
1,188
Sq Ft
$317/Sq Ft
Est. Value
About This Home
This home is located at 773 Evergreen Ct SW, Ocean Shores, WA 98569 and is currently estimated at $376,163, approximately $316 per square foot. 773 Evergreen Ct SW is a home located in Grays Harbor County with nearby schools including North Beach Junior/Senior High School.
Ownership History
Date
Name
Owned For
Owner Type
Purchase Details
Closed on
Aug 23, 2023
Sold by
Sherwood Van
Bought by
Vansherwood William Robert and Sherwood Ann Marie
Current Estimated Value
Home Financials for this Owner
Home Financials are based on the most recent Mortgage that was taken out on this home.
Original Mortgage
$483,000
Outstanding Balance
$339,911
Interest Rate
0.0065%
Mortgage Type
FHA
Estimated Equity
$36,252
Purchase Details
Closed on
Jan 23, 2015
Sold by
Shaw Raymond E and Shaw Judy K
Bought by
Sherwood Van and Abrahamson Ann
Purchase Details
Closed on
Jul 1, 2009
Sold by
Tarbuck Steven C and Tarbuck Patricia M
Bought by
Shaw Raymond E and Shaw Judy K
Purchase Details
Closed on
Feb 8, 2005
Sold by
Barber Clyde E and Barber Elizabeth H
Bought by
Tarbuck Steven C and Tarbuck Patricia M
Create a Home Valuation Report for This Property
The Home Valuation Report is an in-depth analysis detailing your home's value as well as a comparison with similar homes in the area
Home Values in the Area
Average Home Value in this Area
Purchase History
| Date | Buyer | Sale Price | Title Company |
|---|---|---|---|
| Vansherwood William Robert | -- | Fnc Title Services Llc | |
| Sherwood Van | $155,000 | Coast Title | |
| Shaw Raymond E | $28,900 | Grays Harbor Title | |
| Tarbuck Steven C | $15,673 | Grays Harbor Title |
Source: Public Records
Mortgage History
| Date | Status | Borrower | Loan Amount |
|---|---|---|---|
| Open | Vansherwood William Robert | $483,000 | |
| Closed | Vansherwood William Robert | $483,000 |
Source: Public Records
Tax History Compared to Growth
Tax History
| Year | Tax Paid | Tax Assessment Tax Assessment Total Assessment is a certain percentage of the fair market value that is determined by local assessors to be the total taxable value of land and additions on the property. | Land | Improvement |
|---|---|---|---|---|
| 2025 | $2,184 | $344,957 | $45,000 | $299,957 |
| 2023 | $2,205 | $300,088 | $75,000 | $225,088 |
| 2022 | $1,823 | $215,657 | $54,200 | $161,457 |
| 2021 | $1,982 | $215,657 | $54,200 | $161,457 |
| 2020 | $1,857 | $191,967 | $37,375 | $154,592 |
| 2019 | $1,713 | $173,038 | $32,500 | $140,538 |
| 2018 | $1,813 | $155,555 | $25,000 | $130,555 |
| 2017 | $1,844 | $155,555 | $25,000 | $130,555 |
| 2016 | $1,475 | $154,815 | $22,000 | $132,815 |
| 2014 | -- | $128,935 | $12,000 | $116,935 |
| 2013 | -- | $143,480 | $15,000 | $128,480 |
Source: Public Records
Map
Nearby Homes
- 783 Evergreen Ave SE
- 784 Evergreen Ave SE
- 762 Evergreen Ave SE
- 752 Evergreen Ave SE
- 800 Duck Lake Dr SE
- 774 Wakina Loop SE
- 799 Duck Lake Dr SE
- 821 Ketch Ct
- 735 Dover Ct SE
- 723 Trinity Ct SE
- 824 Catala Ave SE
- 737 Wakina Loop SE
- 742 Peninsula Ct SE
- 735 Penninsula Ct SE
- 736 Peninsula Ct
- 804 Meteor Ct SE
- 952 Washoe Ct SE
- 958 Washoe Ct SE
- 956 Washoe Ct SE
- 801 Hassalo Ave SE
- 773 Evergreen Ave SE
- 777 Evergreen Ct SW
- 766 Duck Lake Dr SE
- 770 Evergreen Ct SW
- 767 Evergreen Ave SE
- 767 Evergreen Ct SW
- 782 Duck Lake Dr SE
- 783 Evergreen Ct SW
- 778 Evergreen Ct SW
- 768 Evergreen Ct SW
- 762 Duck Lake Dr SE
- 784 Evergreen Ct SW
- 764 Evergreen Ct SW
- 763 Evergreen Ave SE
- 763 Evergreen Ct SW
- 789 Evergreen Ct SW
- 767 Wakina Loop SE
- 790 Evergreen Ct SW
- 790 Evergreen Ave SE