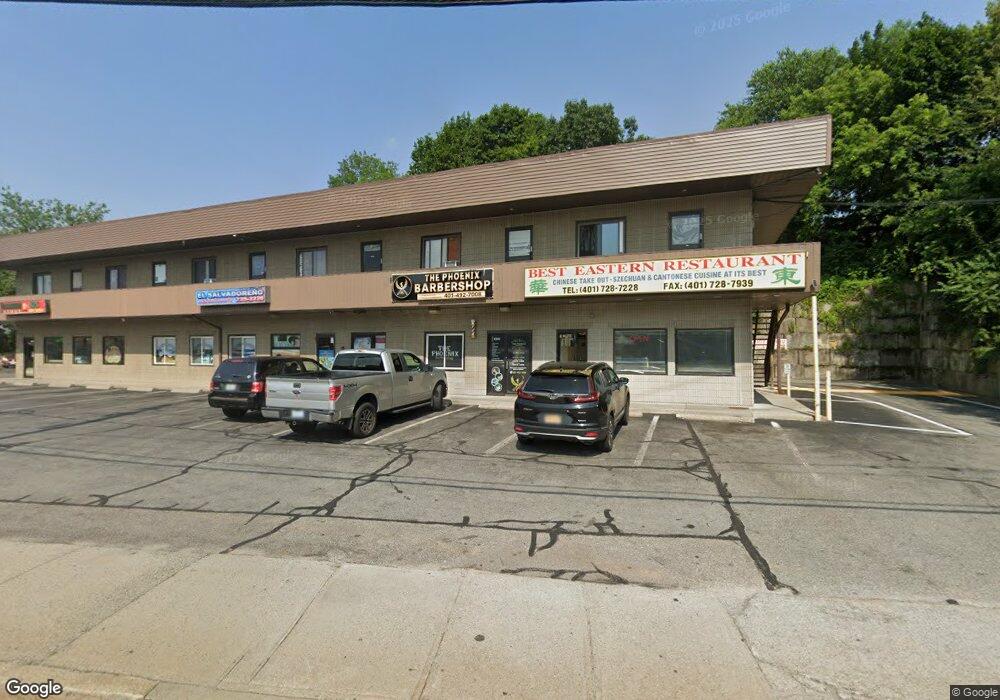
773 Lonsdale Ave Central Falls, RI 02863
Estimated Value: $1,156,979
6
Beds
10
Baths
9,696
Sq Ft
$119/Sq Ft
Est. Value
About This Home
This home is located at 773 Lonsdale Ave, Central Falls, RI 02863 and is currently estimated at $1,156,979, approximately $119 per square foot. 773 Lonsdale Ave is a home located in Providence County with nearby schools including Central Falls Senior High School and Blackstone Valley Prep Junior High School.
Ownership History
Date
Name
Owned For
Owner Type
Purchase Details
Closed on
Dec 10, 2008
Sold by
J & J Investments Inc
Bought by
Mont Real Partners Llc
Current Estimated Value
Home Financials for this Owner
Home Financials are based on the most recent Mortgage that was taken out on this home.
Original Mortgage
$402,750
Outstanding Balance
$270,753
Interest Rate
6.49%
Mortgage Type
Commercial
Estimated Equity
$886,226
Create a Home Valuation Report for This Property
The Home Valuation Report is an in-depth analysis detailing your home's value as well as a comparison with similar homes in the area
Home Values in the Area
Average Home Value in this Area
Purchase History
| Date | Buyer | Sale Price | Title Company |
|---|---|---|---|
| Mont Real Partners Llc | $524,000 | -- |
Source: Public Records
Mortgage History
| Date | Status | Borrower | Loan Amount |
|---|---|---|---|
| Open | Mont Real Partners Llc | $402,750 |
Source: Public Records
Tax History Compared to Growth
Tax History
| Year | Tax Paid | Tax Assessment Tax Assessment Total Assessment is a certain percentage of the fair market value that is determined by local assessors to be the total taxable value of land and additions on the property. | Land | Improvement |
|---|---|---|---|---|
| 2025 | $12,889 | $975,700 | $173,300 | $802,400 |
| 2024 | $13,409 | $602,000 | $135,700 | $466,300 |
| 2023 | $13,409 | $602,000 | $135,700 | $466,300 |
| 2022 | $0 | $602,000 | $135,700 | $466,300 |
| 2021 | $0 | $566,000 | $147,900 | $418,100 |
| 2020 | $13,409 | $566,000 | $147,900 | $418,100 |
| 2019 | $14,014 | $566,000 | $147,900 | $418,100 |
| 2018 | $15,336 | $582,900 | $133,200 | $449,700 |
| 2017 | $15,312 | $582,000 | $133,200 | $448,800 |
| 2016 | $15,091 | $582,000 | $133,200 | $448,800 |
| 2015 | $14,818 | $536,300 | $133,200 | $403,100 |
| 2014 | $14,620 | $536,300 | $133,200 | $403,100 |
| 2013 | $13,794 | $536,300 | $133,200 | $403,100 |
Source: Public Records
Map
Nearby Homes
- 36 Tiffany St
- 722 Dexter St Unit 726
- 71 Brook St
- 61 Orchard St Unit 61
- 10 Barber Ave
- 584 Lonsdale Ave Unit 586
- 31-33 Garfield St
- 129 Liberty St
- 66 Perry St
- 152 Washington St
- 122 Elder St
- 0 Hazel St
- 234 Central St Unit 236
- 75 Olive St
- 116 Foundry St
- 390 Weeden St
- 264 Weeden St
- 533 Weeden St
- 936 Smithfield Ave
- 75 Larch St
- 791 Lonsdale Ave
- 28 Tiffany St
- 32 Tiffany St
- 24 Tiffany St
- 40 Tiffany St
- 37 Park St
- 20 Tiffany St
- 767 Lonsdale Ave Unit 769
- 14 Tiffany St Unit 16
- 16 Tiffany St
- 38 Park St Unit 40
- 42 Park St
- 38-40 Park St
- 25 Tiffany St
- 29 Tiffany St
- 27 Tiffany St
- 27 Tiffany St Unit 2
- 34 Park St
- 10 Tiffany St
- 35 Tiffany St