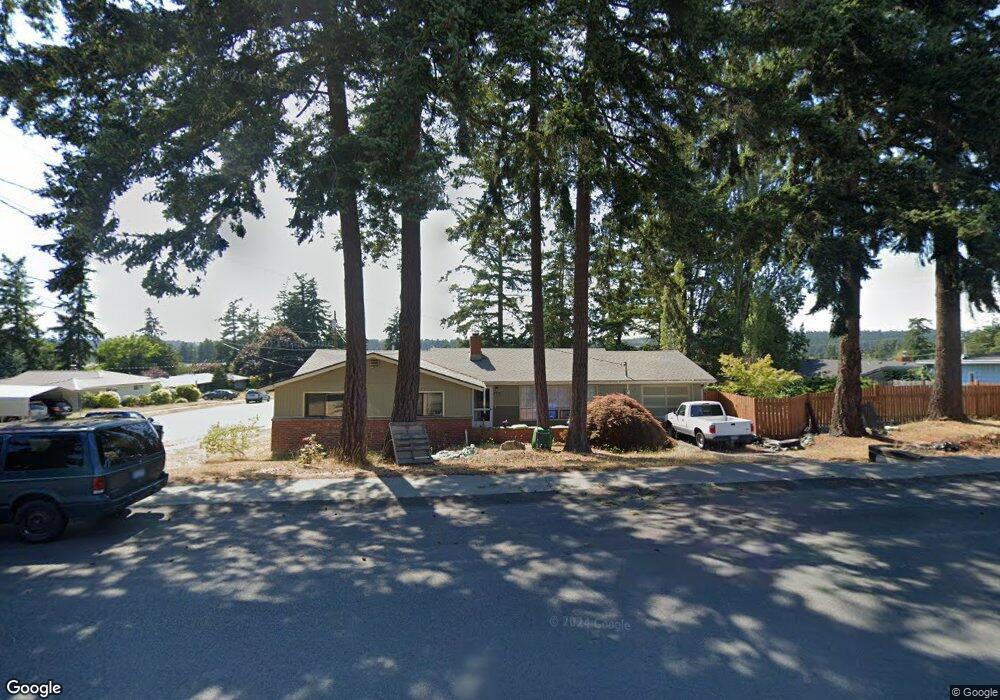
773 NE Oleary St Oak Harbor, WA 98277
Estimated Value: $432,272 - $481,000
3
Beds
3
Baths
1,610
Sq Ft
$284/Sq Ft
Est. Value
About This Home
This home is located at 773 NE Oleary St, Oak Harbor, WA 98277 and is currently estimated at $457,818, approximately $284 per square foot. 773 NE Oleary St is a home located in Island County with nearby schools including Olympic View Elementary School, North Whidbey Middle School, and Oak Harbor High School.
Ownership History
Date
Name
Owned For
Owner Type
Purchase Details
Closed on
Apr 10, 2025
Sold by
Marrs Thomas M
Bought by
Marrs Linda A and Marrs Thomas M
Current Estimated Value
Create a Home Valuation Report for This Property
The Home Valuation Report is an in-depth analysis detailing your home's value as well as a comparison with similar homes in the area
Home Values in the Area
Average Home Value in this Area
Purchase History
| Date | Buyer | Sale Price | Title Company |
|---|---|---|---|
| Marrs Linda A | -- | None Listed On Document |
Source: Public Records
Tax History Compared to Growth
Tax History
| Year | Tax Paid | Tax Assessment Tax Assessment Total Assessment is a certain percentage of the fair market value that is determined by local assessors to be the total taxable value of land and additions on the property. | Land | Improvement |
|---|---|---|---|---|
| 2025 | $3,444 | $412,728 | $180,000 | $232,728 |
| 2024 | $3,399 | $405,905 | $170,000 | $235,905 |
| 2023 | $3,399 | $402,728 | $170,000 | $232,728 |
| 2022 | $3,352 | $372,848 | $160,000 | $212,848 |
| 2021 | $3,046 | $312,578 | $125,000 | $187,578 |
| 2020 | $2,981 | $283,090 | $100,000 | $183,090 |
| 2019 | $2,599 | $274,194 | $140,000 | $134,194 |
| 2018 | $2,851 | $259,628 | $125,000 | $134,628 |
| 2017 | $2,487 | $250,989 | $110,000 | $140,989 |
| 2016 | $2,386 | $233,002 | $90,000 | $143,002 |
| 2015 | $2,288 | $215,017 | $70,000 | $145,017 |
| 2013 | -- | $204,045 | $55,000 | $149,045 |
Source: Public Records
Map
Nearby Homes
- 1662 NE 5th Ave
- 381 NE Queets St
- 1864 NE 11th Ave
- 187 NE Nunan Loop Unit 2
- 544 Easy St
- 0 XXX NE 16th Ave
- 726 E Whidbey Ave
- 225 NE Ernst St Unit Spc 30
- 225 NE Ernst St Unit 61
- 39974 State Route 20
- 0 XX SE Neil St
- 1320 N Oak Harbor St Unit 162
- 1320 N Oak Harbor St Unit 1
- 490 SE Pasek St
- 545 SE O'Leary St
- 1214 NE Big Berry Loop
- 951 NE 21st Ct Unit 3
- 110 N Oak Harbor St
- 0 XXX Goldie Rd Unit 2
- 690 NW Atalanta Way Unit C102
- 1460 NE 7th Place
- 823 NE Oleary St
- 1461 NE 8th Ave
- 768 NE Oleary St
- 1440 NE 7th Place
- 1440 NE 7th Place
- 824 NE O'Leary St
- 824 NE Oleary St
- 1471 NE 7th Place
- 1425 NE 8th Ave
- 738 NE O'Leary St
- 738 NE Oleary St
- 1551 NE 8th Ave
- 1449 NE 7th Place
- 1550 NE 8th Ave
- 1420 NE 7th Place
- 881 NE Oleary St
- 1521 NE 9th Ave
- 1550 NE 7th Ct
- 1460 NE 8th Ave