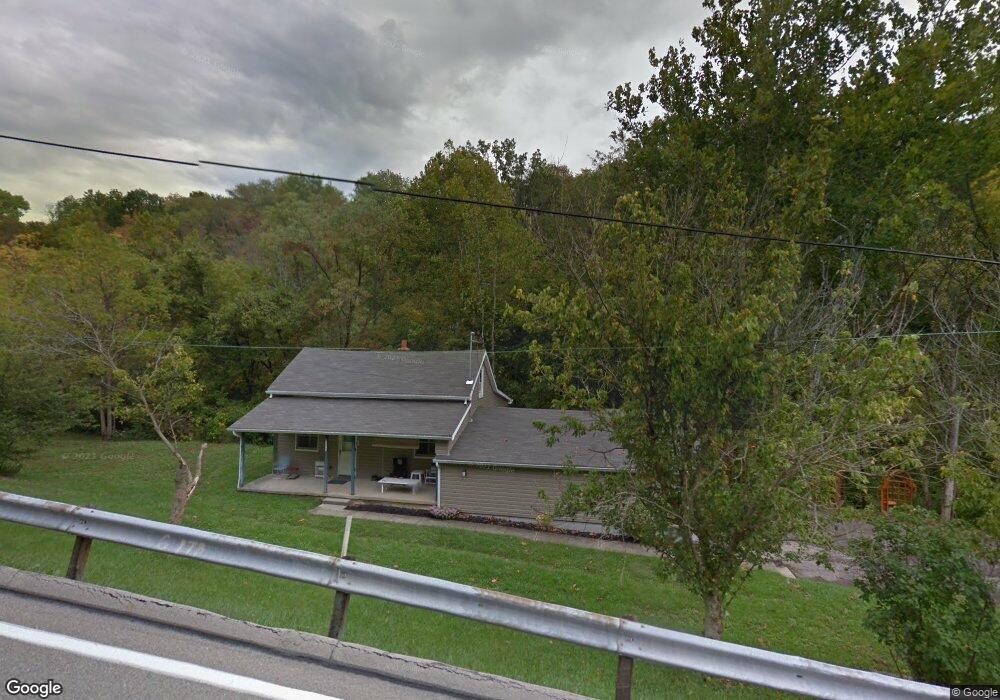
7730 Eagle Creek Rd Cincinnati, OH 45247
Estimated Value: $127,000 - $168,000
2
Beds
1
Bath
896
Sq Ft
$169/Sq Ft
Est. Value
About This Home
This home is located at 7730 Eagle Creek Rd, Cincinnati, OH 45247 and is currently estimated at $151,780, approximately $169 per square foot. 7730 Eagle Creek Rd is a home located in Hamilton County with nearby schools including Colerain Elementary School, Colerain Middle School, and Colerain High School.
Ownership History
Date
Name
Owned For
Owner Type
Purchase Details
Closed on
Dec 1, 2017
Sold by
Losekamp Properties Llc
Bought by
Hayes Austin Lee and Hayes Kimberly Lucille
Current Estimated Value
Home Financials for this Owner
Home Financials are based on the most recent Mortgage that was taken out on this home.
Original Mortgage
$76,000
Outstanding Balance
$63,382
Interest Rate
3.94%
Mortgage Type
New Conventional
Estimated Equity
$88,398
Purchase Details
Closed on
Jul 4, 2008
Sold by
Losekamp Anthony E and Losekamp Edward W
Bought by
Losekamp Properties Llc
Purchase Details
Closed on
Oct 11, 2007
Sold by
Fohl Alice L
Bought by
Losekamp Anthony E and Losekamp Edward W
Home Financials for this Owner
Home Financials are based on the most recent Mortgage that was taken out on this home.
Original Mortgage
$38,000
Interest Rate
6.47%
Mortgage Type
Unknown
Purchase Details
Closed on
Nov 8, 2003
Sold by
Fohl Dewey C and Fohl Alice L
Bought by
Fohl Dewey C and Fohl Alice L
Create a Home Valuation Report for This Property
The Home Valuation Report is an in-depth analysis detailing your home's value as well as a comparison with similar homes in the area
Home Values in the Area
Average Home Value in this Area
Purchase History
| Date | Buyer | Sale Price | Title Company |
|---|---|---|---|
| Hayes Austin Lee | $60,000 | American Homeland Title | |
| Losekamp Properties Llc | -- | Attorney | |
| Losekamp Anthony E | $14,000 | None Available | |
| Fohl Dewey C | -- | -- |
Source: Public Records
Mortgage History
| Date | Status | Borrower | Loan Amount |
|---|---|---|---|
| Open | Hayes Austin Lee | $76,000 | |
| Previous Owner | Losekamp Anthony E | $38,000 |
Source: Public Records
Tax History
| Year | Tax Paid | Tax Assessment Tax Assessment Total Assessment is a certain percentage of the fair market value that is determined by local assessors to be the total taxable value of land and additions on the property. | Land | Improvement |
|---|---|---|---|---|
| 2025 | $2,115 | $36,435 | $15,470 | $20,965 |
| 2023 | $1,972 | $36,435 | $15,470 | $20,965 |
| 2022 | $1,860 | $28,000 | $18,256 | $9,744 |
| 2021 | $1,844 | $28,000 | $18,256 | $9,744 |
| 2020 | $1,863 | $28,000 | $18,256 | $9,744 |
| 2019 | $1,566 | $21,921 | $15,470 | $6,451 |
| 2018 | $1,406 | $21,921 | $15,470 | $6,451 |
| 2017 | $1,399 | $21,921 | $15,470 | $6,451 |
| 2016 | $1,580 | $24,217 | $15,463 | $8,754 |
| 2015 | $1,573 | $24,217 | $15,463 | $8,754 |
| 2014 | $1,577 | $24,217 | $15,463 | $8,754 |
| 2013 | $1,583 | $25,491 | $16,275 | $9,216 |
Source: Public Records
Map
Nearby Homes
- 7880 Austin Ridge Dr
- 7298 Harrison Ave
- 7284 Harrison Ave
- 7240 Creekview Dr
- 7216 Creekview Dr
- 0 Springdale Rd Unit 1869596
- 6823 Thompson Rd
- 7970 Valley Crossing Dr
- 6594 Springdale Rd
- 7524 Bridge Point Pass
- 8515 Merril Ct
- 6983 Daybreak Dr
- 5725 Lofty View Ln Unit 1C
- 6780 Harrison Ave
- 5473 Michelles Oak Ct
- 5401 Michelles Oak Ct
- 7139 Redridge Dr
- 7178 Redridge Dr
- 5089 Greenshire Dr
- 5761 Babygold Ct
- 7671 Eagle Creek Rd
- 7760 Eagle Creek Rd
- 7758 Eagle Creek Rd
- 7625 Eagle Creek Rd
- 7851 Eagle Creek Rd
- 79 Eagle Creek Rd
- 1 Eagle Creek Rd Unit 1
- A Eagle Creek Rd
- 7687 Eagle Creek Rd
- 7687 Eagle Creek Rd
- 7800 Eagle Creek Rd
- 7576 Eagle Creek Rd
- 7886 Eagle Creek Rd
- 7567 Eagle Creek Rd
- 7574 Eagle Creek Rd
- 7936 Eagle Creek Rd
- 8104 Austin Ridge Dr
- 8108 Austin Ridge Dr
- 8100 Austin Ridge Dr
- 8112 Austin Ridge Dr
Your Personal Tour Guide
Ask me questions while you tour the home.