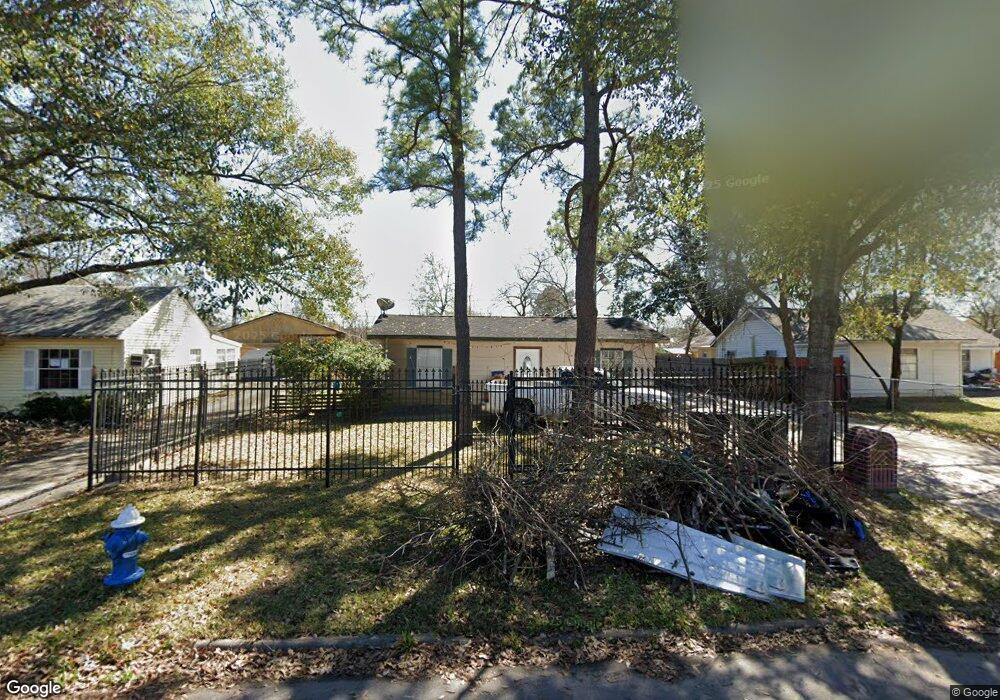
7730 Greendowns St Houston, TX 77087
Golfcrest-Bellfort-Reveille NeighborhoodEstimated Value: $148,996 - $205,000
3
Beds
1
Bath
1,008
Sq Ft
$174/Sq Ft
Est. Value
About This Home
This home is located at 7730 Greendowns St, Houston, TX 77087 and is currently estimated at $175,499, approximately $174 per square foot. 7730 Greendowns St is a home located in Harris County with nearby schools including Golfcrest Elementary School, Hartman Middle School, and Ross Shaw Sterling Aviation High School.
Ownership History
Date
Name
Owned For
Owner Type
Purchase Details
Closed on
Feb 28, 2016
Sold by
Gamboa Ruby and Gamboa Raymond N
Bought by
Torres Jose Daniel Jimenez and Cuellar Maria Teresa
Current Estimated Value
Home Financials for this Owner
Home Financials are based on the most recent Mortgage that was taken out on this home.
Original Mortgage
$3,000
Outstanding Balance
$179
Interest Rate
3.81%
Mortgage Type
Seller Take Back
Estimated Equity
$175,320
Purchase Details
Closed on
Aug 2, 2004
Sold by
Mendoza Obdulio and Mendoza Dora
Bought by
Gamboa Raymond N and Gamboa Ruby
Home Financials for this Owner
Home Financials are based on the most recent Mortgage that was taken out on this home.
Original Mortgage
$70,000
Interest Rate
6.26%
Mortgage Type
Purchase Money Mortgage
Create a Home Valuation Report for This Property
The Home Valuation Report is an in-depth analysis detailing your home's value as well as a comparison with similar homes in the area
Home Values in the Area
Average Home Value in this Area
Purchase History
| Date | Buyer | Sale Price | Title Company |
|---|---|---|---|
| Torres Jose Daniel Jimenez | -- | None Available | |
| Gamboa Raymond N | -- | -- |
Source: Public Records
Mortgage History
| Date | Status | Borrower | Loan Amount |
|---|---|---|---|
| Open | Torres Jose Daniel Jimenez | $3,000 | |
| Previous Owner | Gamboa Raymond N | $70,000 |
Source: Public Records
Tax History Compared to Growth
Tax History
| Year | Tax Paid | Tax Assessment Tax Assessment Total Assessment is a certain percentage of the fair market value that is determined by local assessors to be the total taxable value of land and additions on the property. | Land | Improvement |
|---|---|---|---|---|
| 2025 | $2,826 | $142,534 | $59,616 | $82,918 |
| 2024 | $2,826 | $135,082 | $52,164 | $82,918 |
| 2023 | $2,826 | $137,089 | $52,164 | $84,925 |
| 2022 | $2,699 | $122,560 | $52,164 | $70,396 |
| 2021 | $2,484 | $106,582 | $29,808 | $76,774 |
| 2020 | $2,173 | $89,729 | $22,356 | $67,373 |
| 2019 | $1,894 | $74,863 | $22,356 | $52,507 |
| 2018 | $1,690 | $66,771 | $22,356 | $44,415 |
| 2017 | $1,688 | $66,771 | $22,356 | $44,415 |
| 2016 | $1,497 | $59,194 | $22,356 | $36,838 |
| 2015 | $1,005 | $57,305 | $22,356 | $34,949 |
| 2014 | $1,005 | $57,305 | $22,356 | $34,949 |
Source: Public Records
Map
Nearby Homes
- 3607 De Leon St
- 7659 Greenstone St
- 7703 Mchenry St
- 7937 Grafton St
- 7546 Greendowns St
- 7543 Greenstone St
- 3731 Reveille St
- 7507 Greenstone St
- 7313 Gulf Fwy Unit 814
- 7313 Gulf Fwy Unit 911
- 7313 Gulf Fwy Unit 1011
- 8023 Findlay St
- 3743 Erie St
- 7303 Gulf Fwy Unit 903
- 3727 Broadway St
- 0 Dover St Unit 39828065
- 7393 Fairway Dr Unit B
- 7909 Dixie Dr
- 8145 Easton St
- 7734 El Rancho St
- 7734 Greendowns St
- 7726 Greendowns St
- 7735 Greenstone St
- 7739 Greenstone St
- 7738 Greendowns St
- 7722 Greendowns St
- 7731 Greenstone St
- 7743 Greenstone St
- 7727 Greenstone St
- 7731 Greendowns St
- 7727 Greendowns St Unit 770
- 7742 Greendowns St
- 7718 Greendowns St
- 7747 Greenstone St Unit 770
- 7735 Greendowns St
- 7723 Greenstone St
- 7723 Greendowns St
- 7739 Greendowns St
- 7719 Greenstone St
- 7719 Greendowns St