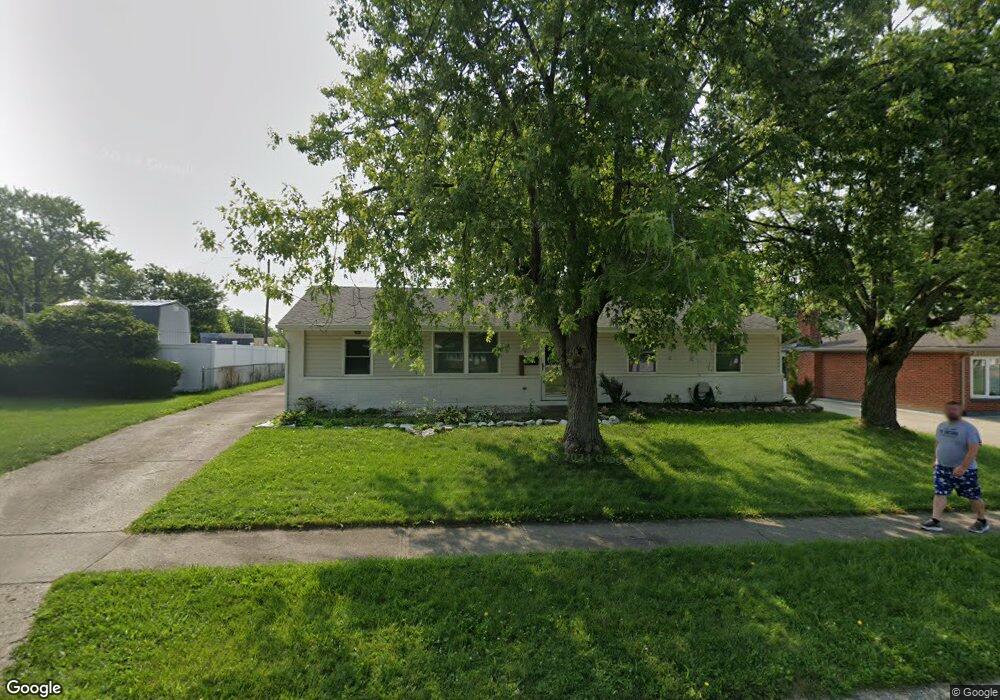
7730 Rothfield Dr Dayton, OH 45424
Estimated Value: $218,000 - $246,000
3
Beds
2
Baths
1,750
Sq Ft
$131/Sq Ft
Est. Value
About This Home
This home is located at 7730 Rothfield Dr, Dayton, OH 45424 and is currently estimated at $228,486, approximately $130 per square foot. 7730 Rothfield Dr is a home located in Montgomery County with nearby schools including Wayne High School and Huber Heights Christian Academy.
Ownership History
Date
Name
Owned For
Owner Type
Purchase Details
Closed on
Aug 28, 2017
Sold by
Miller David A and Miller Bernice A
Bought by
Santus Michael J
Current Estimated Value
Home Financials for this Owner
Home Financials are based on the most recent Mortgage that was taken out on this home.
Original Mortgage
$107,079
Outstanding Balance
$91,383
Interest Rate
4.75%
Mortgage Type
FHA
Estimated Equity
$137,103
Purchase Details
Closed on
Apr 9, 2004
Sold by
Turner Daniel A and Turner Amy M
Bought by
Miller David A and Miller Bernice A
Home Financials for this Owner
Home Financials are based on the most recent Mortgage that was taken out on this home.
Original Mortgage
$81,600
Interest Rate
5.48%
Mortgage Type
Purchase Money Mortgage
Purchase Details
Closed on
Dec 14, 2001
Sold by
Turner Clifton D and Turner Lorraine E
Bought by
Turner Ii Daniel A and Turner Amy M
Home Financials for this Owner
Home Financials are based on the most recent Mortgage that was taken out on this home.
Original Mortgage
$98,861
Interest Rate
6.87%
Mortgage Type
FHA
Create a Home Valuation Report for This Property
The Home Valuation Report is an in-depth analysis detailing your home's value as well as a comparison with similar homes in the area
Home Values in the Area
Average Home Value in this Area
Purchase History
| Date | Buyer | Sale Price | Title Company |
|---|---|---|---|
| Santus Michael J | $109,100 | Springdale Title Llc | |
| Miller David A | $102,000 | -- | |
| Turner Ii Daniel A | $99,700 | -- |
Source: Public Records
Mortgage History
| Date | Status | Borrower | Loan Amount |
|---|---|---|---|
| Open | Santus Michael J | $107,079 | |
| Previous Owner | Miller David A | $81,600 | |
| Previous Owner | Turner Ii Daniel A | $98,861 |
Source: Public Records
Tax History Compared to Growth
Tax History
| Year | Tax Paid | Tax Assessment Tax Assessment Total Assessment is a certain percentage of the fair market value that is determined by local assessors to be the total taxable value of land and additions on the property. | Land | Improvement |
|---|---|---|---|---|
| 2024 | $2,968 | $57,630 | $10,150 | $47,480 |
| 2023 | $2,968 | $57,630 | $10,150 | $47,480 |
| 2022 | $2,594 | $39,700 | $7,000 | $32,700 |
| 2021 | $2,632 | $39,700 | $7,000 | $32,700 |
| 2020 | $2,634 | $39,700 | $7,000 | $32,700 |
| 2019 | $2,483 | $33,060 | $7,000 | $26,060 |
| 2018 | $2,491 | $33,060 | $7,000 | $26,060 |
| 2017 | $2,474 | $33,060 | $7,000 | $26,060 |
| 2016 | $2,348 | $30,560 | $7,000 | $23,560 |
| 2015 | $2,318 | $30,560 | $7,000 | $23,560 |
| 2014 | $2,318 | $30,560 | $7,000 | $23,560 |
| 2012 | -- | $32,460 | $8,750 | $23,710 |
Source: Public Records
Map
Nearby Homes
- 6681 Spokane Dr
- 6701 Springport Way
- 7866 Harshmanville Rd
- 7854 Harshmanville Rd
- 7741 Shalamar Dr
- 6605 Highbury Rd
- 7371 Damascus Dr
- 7833 Harshmanville Rd
- 6447 Highbury Rd
- 7660 Stonecrest Dr
- 7611 Shepherdess Dr
- 8282 Briar Ridge Ct
- 6601 Grovehill Dr
- 6811 Highbury Rd
- 7011 Safari Dr
- 6150 Taylorsville Rd
- 6960 Serene Place
- 7150 Harshmanville Rd
- 7211 Stonehurst Dr
- 7221 Serpentine Dr
- 7720 Rothfield Dr
- 7750 Rothfield Dr
- 7729 Stonesboro Dr
- 7719 Stonesboro Dr
- 7710 Rothfield Dr
- 7770 Rothfield Dr
- 7731 Rothfield Dr
- 7721 Rothfield Dr
- 7741 Rothfield Dr
- 7711 Stonesboro Dr
- 7711 Rothfield Dr
- 7751 Rothfield Dr
- 7700 Rothfield Dr
- 7680 Stancrest Dr
- 7761 Rothfield Dr
- 7771 Rothfield Dr
- 7740 Remmick Ln
- 7750 Remmick Ln
- 7740 Stonesboro Dr
- 7701 Rothfield Dr