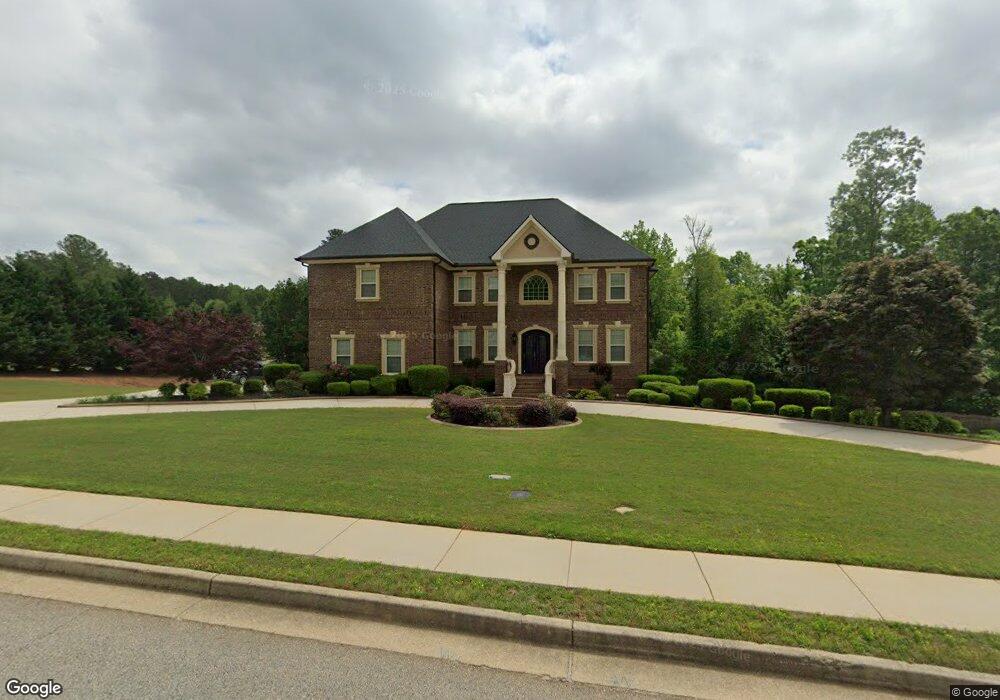
7731 Capps Ridge Ln Douglasville, GA 30135
Estimated Value: $806,235 - $972,000
5
Beds
6
Baths
4,175
Sq Ft
$209/Sq Ft
Est. Value
About This Home
This home is located at 7731 Capps Ridge Ln, Douglasville, GA 30135 and is currently estimated at $874,078, approximately $209 per square foot. 7731 Capps Ridge Ln is a home located in Douglas County with nearby schools including South Douglas Elementary School, Fairplay Middle School, and Alexander High School.
Ownership History
Date
Name
Owned For
Owner Type
Purchase Details
Closed on
Jun 9, 2009
Sold by
Cunningham Homes Inc
Bought by
Peters Broderick J and Peters Rosalyn H
Current Estimated Value
Home Financials for this Owner
Home Financials are based on the most recent Mortgage that was taken out on this home.
Original Mortgage
$500,000
Outstanding Balance
$315,907
Interest Rate
4.77%
Mortgage Type
VA
Estimated Equity
$558,171
Purchase Details
Closed on
Sep 5, 2008
Sold by
Peters Broderick J and Peters Rosalyn H
Bought by
Cunningham Homes Inc
Home Financials for this Owner
Home Financials are based on the most recent Mortgage that was taken out on this home.
Original Mortgage
$416,000
Interest Rate
6.48%
Purchase Details
Closed on
Jul 15, 2008
Sold by
Roarke Properties
Bought by
Peters Broderick J and Peters Rosalyn H
Home Financials for this Owner
Home Financials are based on the most recent Mortgage that was taken out on this home.
Original Mortgage
$416,000
Interest Rate
6.48%
Create a Home Valuation Report for This Property
The Home Valuation Report is an in-depth analysis detailing your home's value as well as a comparison with similar homes in the area
Home Values in the Area
Average Home Value in this Area
Purchase History
| Date | Buyer | Sale Price | Title Company |
|---|---|---|---|
| Peters Broderick J | $535,500 | -- | |
| Cunningham Homes Inc | -- | -- | |
| Peters Broderick J | -- | -- | |
| Peters Broderick J | -- | -- |
Source: Public Records
Mortgage History
| Date | Status | Borrower | Loan Amount |
|---|---|---|---|
| Open | Peters Broderick J | $500,000 | |
| Previous Owner | Peters Broderick J | $416,000 |
Source: Public Records
Tax History Compared to Growth
Tax History
| Year | Tax Paid | Tax Assessment Tax Assessment Total Assessment is a certain percentage of the fair market value that is determined by local assessors to be the total taxable value of land and additions on the property. | Land | Improvement |
|---|---|---|---|---|
| 2024 | $876 | $347,040 | $30,000 | $317,040 |
| 2023 | $876 | $341,360 | $30,000 | $311,360 |
| 2022 | $1,102 | $248,960 | $24,000 | $224,960 |
| 2021 | $1,113 | $232,200 | $22,080 | $210,120 |
| 2020 | $1,236 | $217,000 | $20,640 | $196,360 |
| 2019 | $3,531 | $204,560 | $20,160 | $184,400 |
| 2018 | $4,322 | $234,760 | $23,760 | $211,000 |
| 2017 | $3,980 | $209,640 | $23,760 | $185,880 |
| 2016 | $3,220 | $171,840 | $20,400 | $151,440 |
| 2015 | $3,102 | $166,920 | $20,400 | $146,520 |
| 2014 | $3,102 | $158,200 | $20,400 | $137,800 |
| 2013 | -- | $161,120 | $20,640 | $140,480 |
Source: Public Records
Map
Nearby Homes
- 7794 Gusty Trail
- 7641 Capps Ridge Ln
- 7762 Capps Ridge Ln
- 7782 Capps Ridge Ln
- Cleveland Plan at The Estates at Hurricane Pointe - Executive Series
- Wilson Plan at The Estates at Hurricane Pointe - Executive Series
- Parker Plan at The Estates at Hurricane Pointe - Executive Series
- William Plan at The Estates at Hurricane Pointe - Executive Series
- Adams Plan at The Estates at Hurricane Pointe - Executive Series
- Taylor Plan at The Estates at Hurricane Pointe - Executive Series
- 7580 Sunridge Ln
- 7791 Capps Ridge Ln
- 7590 Sunridge Ln
- 7731 Windswept Way
- 7801 Windswept Way
- 7519 Waterview Cove
- 7260 Bluewater Ln
- 7497 Treehouse Ct
- 7810 Capps Ferry Rd
- 7681 Capps Ridge Ln
- 7741 Capps Ridge Ln
- 7363 Breeze St
- 7742 Capps Ridge Ln
- 0 Capps Ridge Ln Unit 59 LOTS 7533352
- 0 Capps Ridge Ln Unit 5603652
- 0 Capps Ridge Ln Unit 7378042
- 0 Capps Ridge Ln Unit 7378041
- 0 Capps Ridge Ln Unit 7253784
- 0 Capps Ridge Ln Unit 7170292
- 0 Capps Ridge Ln Unit 7170290
- 0 Capps Ridge Ln Unit 7170291
- 0 Capps Ridge Ln Unit 7005199
- 0 Capps Ridge Ln Unit 7005197
- 0 Capps Ridge Ln Unit 7081772
- 0 Capps Ridge Ln Unit 7081770
- 0 Capps Ridge Ln Unit 3173481
- 0 Capps Ridge Ln Unit 8979298
- 0 Capps Ridge Ln Unit 8725704
- 0 Capps Ridge Ln Unit 9066520