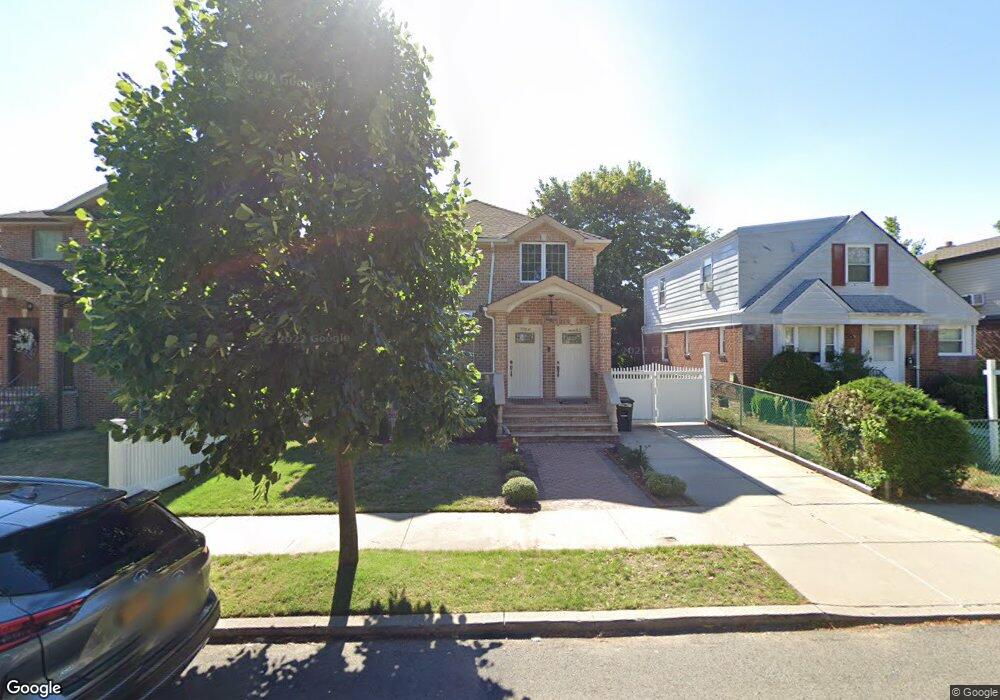
7732 252nd St Unit 2nd Fl Bellerose, NY 11426
Glen Oaks NeighborhoodEstimated Value: $965,000 - $1,288,000
3
Beds
2
Baths
1,100
Sq Ft
$1,060/Sq Ft
Est. Value
About This Home
This home is located at 7732 252nd St Unit 2nd Fl, Bellerose, NY 11426 and is currently estimated at $1,165,667, approximately $1,059 per square foot. 7732 252nd St Unit 2nd Fl is a home located in Queens County with nearby schools including P.S. 186 Castlewood, Louis Pasteur Middle School 67, and Martin Van Buren High School.
Ownership History
Date
Name
Owned For
Owner Type
Purchase Details
Closed on
Dec 10, 2012
Sold by
Tomar Pratik and Tomar Sherry
Bought by
Ramnath Rajpatie and Tomar Pratik
Current Estimated Value
Purchase Details
Closed on
Jun 30, 2009
Sold by
Kumar Rajat and Tomar Sherry
Bought by
Tomar Pratik and Tomar Sherry
Purchase Details
Closed on
Feb 18, 2009
Sold by
Simon Harriet and Simon Mark
Bought by
Kumar Rajat and Tomar Sherry
Home Financials for this Owner
Home Financials are based on the most recent Mortgage that was taken out on this home.
Original Mortgage
$340,000
Interest Rate
5.14%
Mortgage Type
Commercial
Purchase Details
Closed on
May 17, 2004
Sold by
Simon Harriet
Bought by
Simon Harriet and Simon Mark
Create a Home Valuation Report for This Property
The Home Valuation Report is an in-depth analysis detailing your home's value as well as a comparison with similar homes in the area
Home Values in the Area
Average Home Value in this Area
Purchase History
| Date | Buyer | Sale Price | Title Company |
|---|---|---|---|
| Ramnath Rajpatie | -- | -- | |
| Ramnath Rajpatie | -- | -- | |
| Ramnath Rajpatie | -- | -- | |
| Ramnath Rajpatie | -- | -- | |
| Tomar Pratik | -- | -- | |
| Tomar Pratik | -- | -- | |
| Tomar Pratik | -- | -- | |
| Tomar Pratik | -- | -- | |
| Kumar Rajat | $425,000 | -- | |
| Kumar Rajat | $425,000 | -- | |
| Kumar Rajat | $425,000 | -- | |
| Kumar Rajat | $425,000 | -- | |
| Simon Harriet | -- | -- | |
| Simon Harriet | -- | -- | |
| Simon Harriet | -- | -- | |
| Simon Harriet | -- | -- |
Source: Public Records
Mortgage History
| Date | Status | Borrower | Loan Amount |
|---|---|---|---|
| Previous Owner | Kumar Rajat | $340,000 |
Source: Public Records
Tax History
| Year | Tax Paid | Tax Assessment Tax Assessment Total Assessment is a certain percentage of the fair market value that is determined by local assessors to be the total taxable value of land and additions on the property. | Land | Improvement |
|---|---|---|---|---|
| 2025 | $10,048 | $50,026 | $10,551 | $39,475 |
| 2024 | $10,048 | $50,026 | $12,023 | $38,003 |
| 2023 | $9,972 | $49,649 | $10,729 | $38,920 |
| 2022 | $9,513 | $66,660 | $15,300 | $51,360 |
| 2021 | $9,351 | $66,240 | $15,300 | $50,940 |
| 2020 | $8,824 | $72,840 | $15,300 | $57,540 |
| 2019 | $8,721 | $65,760 | $15,300 | $50,460 |
| 2018 | $8,434 | $41,374 | $12,113 | $29,261 |
| 2017 | $7,957 | $39,033 | $13,748 | $25,285 |
| 2016 | $7,361 | $39,033 | $13,748 | $25,285 |
| 2015 | $5,309 | $34,740 | $16,980 | $17,760 |
| 2014 | $5,309 | $34,740 | $16,980 | $17,760 |
Source: Public Records
Map
Nearby Homes
- 7719 252nd St
- 7734 Little Neck Pkwy
- 25103 Union Turnpike
- 254-61 75th Ave Unit A11-1
- 254-07 74th Ave Unit GV64 B1-1
- 80-35 249th St
- 250-12 81st Ave
- 247-10 76th Ave Unit 2nd fl
- 8023 247th St
- 245-33 77th Crescent Unit 1st fl
- 81-32 252nd St
- 245-23B Union Turnpike Unit G3C
- 245-31 76th Ave Unit 31B
- 255-25 74th Ave Unit 2nd fl
- 245-17 76th Ave Unit 1st fl
- 74-12 260th St Unit H-2
- 254-24 73rd Rd Unit 68
- 81-24 248th St
- 8127 247th St
- 8201 251st St
- 7732 252nd St
- 7732 252nd St
- 7732 252nd St Unit 1st Fl
- 7732 252nd St
- 77-36 252nd St Unit 1st Fl
- 7736 252nd St Unit 2nd Fl
- 7736 252nd St
- 7736 252nd St Unit 1st Fl
- 7736 252nd St
- 7728 252nd St Unit 1st Fl
- 7728 252nd St Unit 2nd Fl
- 7728 252nd St
- 7728 252nd St
- 7728 252nd St Unit 2Md
- 7728 252nd St Unit 2nd
- 7728 252nd St Unit 1st Fl
- 77-28 252nd St Unit Duplex
- 7728 252nd St
- 77-40 252nd St
- 7740 252nd St
Your Personal Tour Guide
Ask me questions while you tour the home.