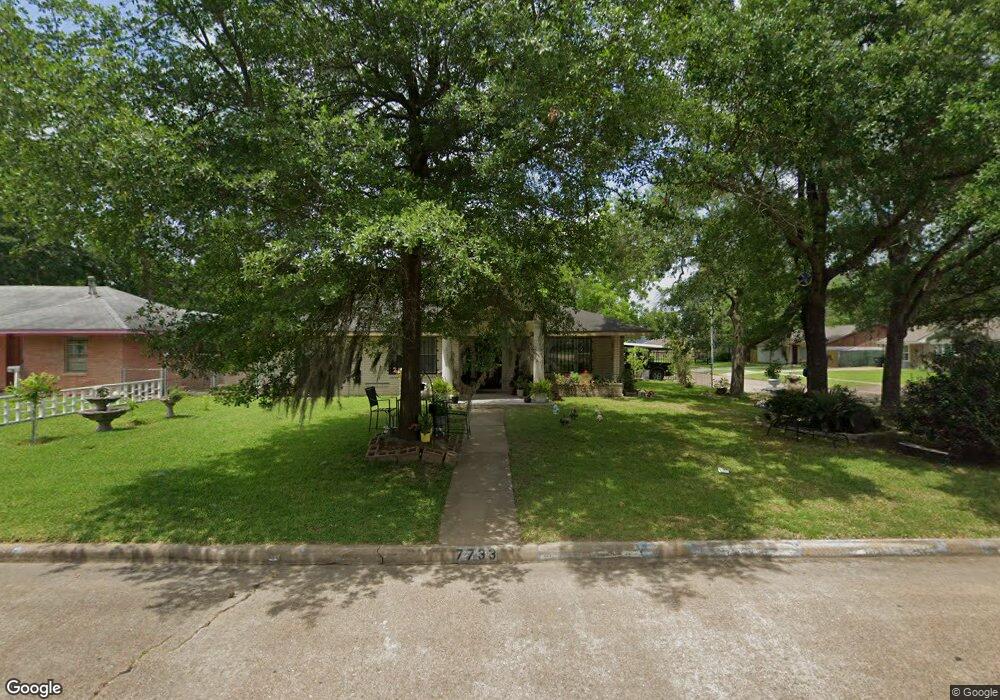
7733 Rhobell St Houston, TX 77016
East Little York NeighborhoodEstimated Value: $202,633 - $246,000
3
Beds
1
Bath
2,042
Sq Ft
$109/Sq Ft
Est. Value
About This Home
This home is located at 7733 Rhobell St, Houston, TX 77016 and is currently estimated at $222,408, approximately $108 per square foot. 7733 Rhobell St is a home located in Harris County with nearby schools including Shadydale Elementary School, Forest Brook Middle, and North Forest High School.
Ownership History
Date
Name
Owned For
Owner Type
Purchase Details
Closed on
Oct 13, 2009
Sold by
Fannie Mae
Bought by
Lopez Nicolas
Current Estimated Value
Purchase Details
Closed on
Feb 12, 2009
Sold by
James B Nutter & Company
Bought by
Federal National Mortgage Association
Purchase Details
Closed on
Feb 3, 2009
Sold by
Turner Thelma W and Whitaker Curtis
Bought by
James B Nutter & Company
Purchase Details
Closed on
Oct 3, 2007
Sold by
Turner Thelma W
Bought by
Turner Thelma W and Whitaker Curtis
Home Financials for this Owner
Home Financials are based on the most recent Mortgage that was taken out on this home.
Original Mortgage
$151,500
Interest Rate
5.55%
Mortgage Type
Reverse Mortgage Home Equity Conversion Mortgage
Create a Home Valuation Report for This Property
The Home Valuation Report is an in-depth analysis detailing your home's value as well as a comparison with similar homes in the area
Home Values in the Area
Average Home Value in this Area
Purchase History
| Date | Buyer | Sale Price | Title Company |
|---|---|---|---|
| Lopez Nicolas | -- | None Available | |
| Federal National Mortgage Association | -- | None Available | |
| James B Nutter & Company | $32,000 | None Available | |
| Turner Thelma W | -- | Title Stream |
Source: Public Records
Mortgage History
| Date | Status | Borrower | Loan Amount |
|---|---|---|---|
| Previous Owner | Turner Thelma W | $151,500 |
Source: Public Records
Tax History Compared to Growth
Tax History
| Year | Tax Paid | Tax Assessment Tax Assessment Total Assessment is a certain percentage of the fair market value that is determined by local assessors to be the total taxable value of land and additions on the property. | Land | Improvement |
|---|---|---|---|---|
| 2025 | $126 | $186,000 | $45,891 | $140,109 |
| 2024 | $126 | $186,000 | $45,891 | $140,109 |
| 2023 | $126 | $238,335 | $45,891 | $192,444 |
| 2022 | $3,933 | $203,529 | $38,548 | $164,981 |
| 2021 | $3,907 | $167,652 | $25,699 | $141,953 |
| 2020 | $3,627 | $149,759 | $19,091 | $130,668 |
| 2019 | $3,396 | $134,200 | $13,951 | $120,249 |
| 2018 | $2,392 | $94,535 | $12,556 | $81,979 |
| 2017 | $2,390 | $94,535 | $12,556 | $81,979 |
| 2016 | $2,247 | $88,849 | $12,556 | $76,293 |
| 2015 | $1,660 | $73,167 | $12,556 | $60,611 |
| 2014 | $1,660 | $64,580 | $12,556 | $52,024 |
Source: Public Records
Map
Nearby Homes
- 8022 Yoe St
- 7717 Bigwood St
- 7639 Bigwood St
- 10035 Tiger Flower Ln
- 7603 Caddo Rd
- 7826 Flowering Lotus Ln
- 10101 Rebel Rd
- 10125 Rebel Rd
- 10210 Red Orchid Dr
- 10219 Red Orchid Dr
- 10206 Red Orchid Dr
- 10230 Red Orchid Dr
- 7611 Cabot St
- 10106 Cheeves Dr
- 7618 Boggess Rd
- 9714 Galaxy St
- 7807 Lavender Lantana Ln
- 10314 Red Orchid Dr
- 10206 Cheeves Dr
- Voyager Plan at Wayside Village
- 7729 Rhobell St
- 7725 Rhobell St
- * Rhobell St
- 7734 Yoe St
- 7730 Yoe St
- 10102 Woodwick St
- 10106 Woodwick St
- 7726 Yoe St
- 10110 Woodwick St
- 7734 Rhobell St
- 7721 Rhobell St
- 7730 Rhobell St
- 10114 Woodwick St
- 8018 Yoe St
- 8014 Yoe St
- 7722 Yoe St
- 7726 Rhobell St
- 10034 Woodwick St
- 7717 Rhobell St
- 10118 Woodwick St