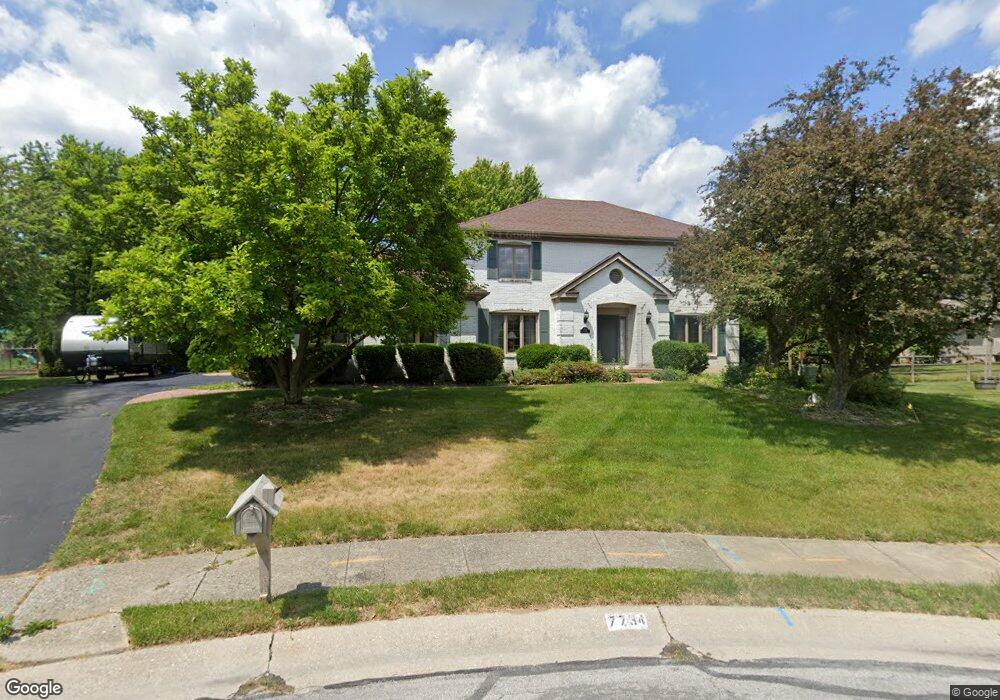
7734 Gillcrest Rd Sylvania, OH 43560
Estimated Value: $416,837 - $447,000
4
Beds
3
Baths
2,922
Sq Ft
$147/Sq Ft
Est. Value
About This Home
This home is located at 7734 Gillcrest Rd, Sylvania, OH 43560 and is currently estimated at $428,709, approximately $146 per square foot. 7734 Gillcrest Rd is a home located in Lucas County with nearby schools including Highland Elementary School, Sylvania McCord Junior High School, and Sylvania Northview High School.
Ownership History
Date
Name
Owned For
Owner Type
Purchase Details
Closed on
Mar 12, 2024
Sold by
Bonnetta R Becker Living Revocable Trust
Bought by
Becker Toni and Becker Herman
Current Estimated Value
Home Financials for this Owner
Home Financials are based on the most recent Mortgage that was taken out on this home.
Original Mortgage
$293,000
Outstanding Balance
$288,127
Interest Rate
6.63%
Mortgage Type
New Conventional
Estimated Equity
$140,582
Purchase Details
Closed on
Oct 22, 2018
Sold by
Becker Bonnetta R and Becker Bonnetta Rose
Bought by
Becker Toni K and The Bonnetta R Becker Living R
Purchase Details
Closed on
Mar 26, 1990
Purchase Details
Closed on
Sep 19, 1989
Sold by
Wilcox Frank J
Purchase Details
Closed on
Jul 11, 1988
Purchase Details
Closed on
May 27, 1988
Create a Home Valuation Report for This Property
The Home Valuation Report is an in-depth analysis detailing your home's value as well as a comparison with similar homes in the area
Home Values in the Area
Average Home Value in this Area
Purchase History
| Date | Buyer | Sale Price | Title Company |
|---|---|---|---|
| Becker Toni | $396,000 | None Listed On Document | |
| Becker Toni K | -- | None Available | |
| -- | $165,000 | -- | |
| -- | -- | -- | |
| -- | $45,000 | -- | |
| -- | -- | -- |
Source: Public Records
Mortgage History
| Date | Status | Borrower | Loan Amount |
|---|---|---|---|
| Open | Becker Toni | $293,000 |
Source: Public Records
Tax History Compared to Growth
Tax History
| Year | Tax Paid | Tax Assessment Tax Assessment Total Assessment is a certain percentage of the fair market value that is determined by local assessors to be the total taxable value of land and additions on the property. | Land | Improvement |
|---|---|---|---|---|
| 2024 | $4,165 | $132,265 | $15,890 | $116,375 |
| 2023 | $7,493 | $103,565 | $14,315 | $89,250 |
| 2022 | $7,504 | $103,565 | $14,315 | $89,250 |
| 2021 | $7,710 | $103,565 | $14,315 | $89,250 |
| 2020 | $7,482 | $89,285 | $11,970 | $77,315 |
| 2019 | $7,197 | $89,285 | $11,970 | $77,315 |
| 2018 | $6,172 | $89,285 | $11,970 | $77,315 |
| 2017 | $6,330 | $80,185 | $14,665 | $65,520 |
| 2016 | $6,204 | $229,100 | $41,900 | $187,200 |
| 2015 | $5,837 | $229,100 | $41,900 | $187,200 |
| 2014 | $5,404 | $77,110 | $14,110 | $63,000 |
| 2013 | $5,404 | $77,110 | $14,110 | $63,000 |
Source: Public Records
Map
Nearby Homes
- 7858 Erie St
- 6047 Peppermill Dr
- 5555 Birch Hollow Ct
- 6129 Burrwood Dr
- 5646 Breezy Porch Dr
- 5310 Turnberry Ln
- 5346 Palisades Dr
- 5255 Fairmeadow Dr
- 5235 Brookfield Ln
- 6053 Gregory Dr
- 5550 Olde Post Rd
- 8362 Sylvania Metamora Rd
- 8332 Fossil Dr Unit 8332
- 5060 Olde Mill Ct
- 5937 Brainard Dr
- 7120 Grenlock Dr
- 6023 Brainard Dr
- 5046 King Rd
- 7639 Cobblestone Dr
- 7430 Country Commons Ln
- 7742 Gillcrest Rd
- 5739 Foxpointe Dr
- 5749 Foxpointe Dr
- 7724 Gillcrest Rd
- 7735 Erie St
- 7745 Erie St
- 5729 Little Farms Ct
- 5470 Little Farms Ct
- 7743 Gillcrest Rd
- 7753 Erie St
- 5759 Foxpointe Dr
- 7805 Erie St
- 7733 Gillcrest Rd
- 7739 Gillcrest Rd
- 5733 Little Farms Ct
- 5738 Foxpointe Dr
- 5728 Foxpointe Dr
- 5748 Foxpointe Dr
- 7725 Gillcrest Rd
- 5737 Little Farms Ct