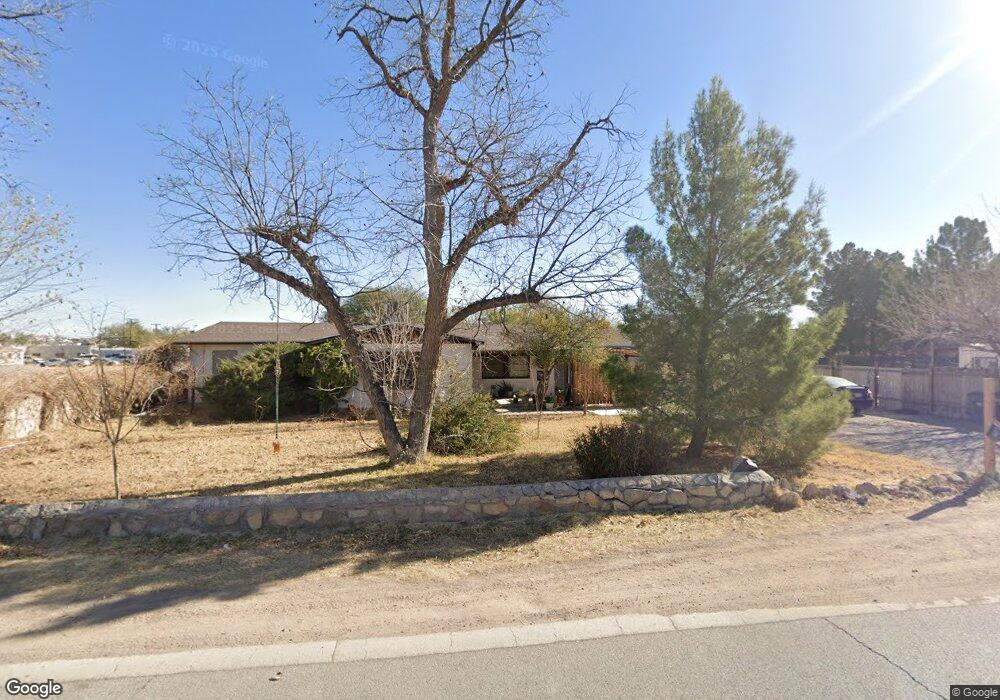
7735 S Rosedale St El Paso, TX 79915
Rosedale Farms NeighborhoodEstimated Value: $231,000 - $295,435
4
Beds
2
Baths
2,501
Sq Ft
$99/Sq Ft
Est. Value
About This Home
This home is located at 7735 S Rosedale St, El Paso, TX 79915 and is currently estimated at $248,609, approximately $99 per square foot. 7735 S Rosedale St is a home located in El Paso County with nearby schools including Riverside Middle School, Riverside High School, and Ramona STEM Academy.
Ownership History
Date
Name
Owned For
Owner Type
Purchase Details
Closed on
Oct 21, 2025
Sold by
Cuamba Juan Carlos Segovia and Juarez Nabil M
Bought by
Rocha Mayela and Barrios Ruben Briones
Current Estimated Value
Purchase Details
Closed on
Dec 2, 2020
Sold by
Rocha Mayela Del Carmen and Briones Ruben
Bought by
Cuamba Juan Carlos Segov
Home Financials for this Owner
Home Financials are based on the most recent Mortgage that was taken out on this home.
Original Mortgage
$157,102
Interest Rate
2.8%
Mortgage Type
FHA
Purchase Details
Closed on
Sep 14, 2012
Sold by
C & J Property Corp Inc
Bought by
Rocha Mayela Del Carmen
Home Financials for this Owner
Home Financials are based on the most recent Mortgage that was taken out on this home.
Original Mortgage
$89,000
Interest Rate
3.66%
Mortgage Type
Purchase Money Mortgage
Create a Home Valuation Report for This Property
The Home Valuation Report is an in-depth analysis detailing your home's value as well as a comparison with similar homes in the area
Home Values in the Area
Average Home Value in this Area
Purchase History
| Date | Buyer | Sale Price | Title Company |
|---|---|---|---|
| Rocha Mayela | -- | None Listed On Document | |
| Cuamba Juan Carlos Segov | -- | None Listed On Document | |
| Rocha Mayela Del Carmen | -- | None Available |
Source: Public Records
Mortgage History
| Date | Status | Borrower | Loan Amount |
|---|---|---|---|
| Previous Owner | Cuamba Juan Carlos Segov | $157,102 | |
| Previous Owner | Rocha Mayela Del Carmen | $89,000 |
Source: Public Records
Tax History Compared to Growth
Tax History
| Year | Tax Paid | Tax Assessment Tax Assessment Total Assessment is a certain percentage of the fair market value that is determined by local assessors to be the total taxable value of land and additions on the property. | Land | Improvement |
|---|---|---|---|---|
| 2025 | $3,970 | $235,282 | -- | -- |
| 2024 | $3,970 | $213,893 | -- | -- |
| 2023 | $3,970 | $194,448 | $0 | $0 |
| 2022 | $5,489 | $176,771 | $0 | $0 |
| 2021 | $5,224 | $160,701 | $17,838 | $142,863 |
| 2020 | $3,172 | $133,675 | $17,838 | $115,837 |
| 2019 | $2,865 | $133,675 | $17,838 | $115,837 |
| 2018 | $2,581 | $82,992 | $17,838 | $65,154 |
| 2017 | $2,390 | $78,195 | $17,838 | $60,357 |
| 2016 | $2,390 | $78,195 | $17,838 | $60,357 |
| 2015 | $2,468 | $78,195 | $17,838 | $60,357 |
| 2014 | $2,468 | $86,253 | $17,838 | $68,415 |
Source: Public Records
Map
Nearby Homes
- 7798 Rosedale St
- 7909 La Jolla Dr
- 443 Cadwallader Dr
- 537 Emerson St
- 7921 Lirio Rd
- 423 N Carolina Dr
- 7632 Franklin Dr Unit 1-2
- 205 Kelvin Ave
- 7907 Alameda Ave
- 7807 Porche St
- 223 Kelvin Ave
- 7556 N Loop Dr
- 222 Kelvin Ave
- 104 Chip Way
- 3 Atkinson Way
- 7655 Hacienda Ave
- 310 Kelvin Ave
- 7860 Porche St
- 405 Lafayette Dr
- 525 Lafayette Dr
- 7735 Rosedale St
- 7745 Rosedale St
- 7730 Rosedale St
- 7752 Rosedale St
- 7738 Rosedale St
- 7750 Rosedale St
- 7736 Rosedale St
- 7749 Rosedale St
- 7789 Rosedale St
- 7723 Rosedale St
- 7723 S Rosedale St
- 7722 N Loop Dr
- 7754 Rosedale St
- 7759 Rosedale St
- 7720 Rosedale St
- 7709 Rosedale St
- 7758 Rosedale St
- 7769 Rosedale St
- 7792 Franklin Dr
- 7739 Wenda Dr