
Landlord's Agent in 2019
Tom Eickleberry
Pride St. Realty, LLC
(713) 201-5257
49 Total Sales
Estimated Value: $132,185 - $145,000
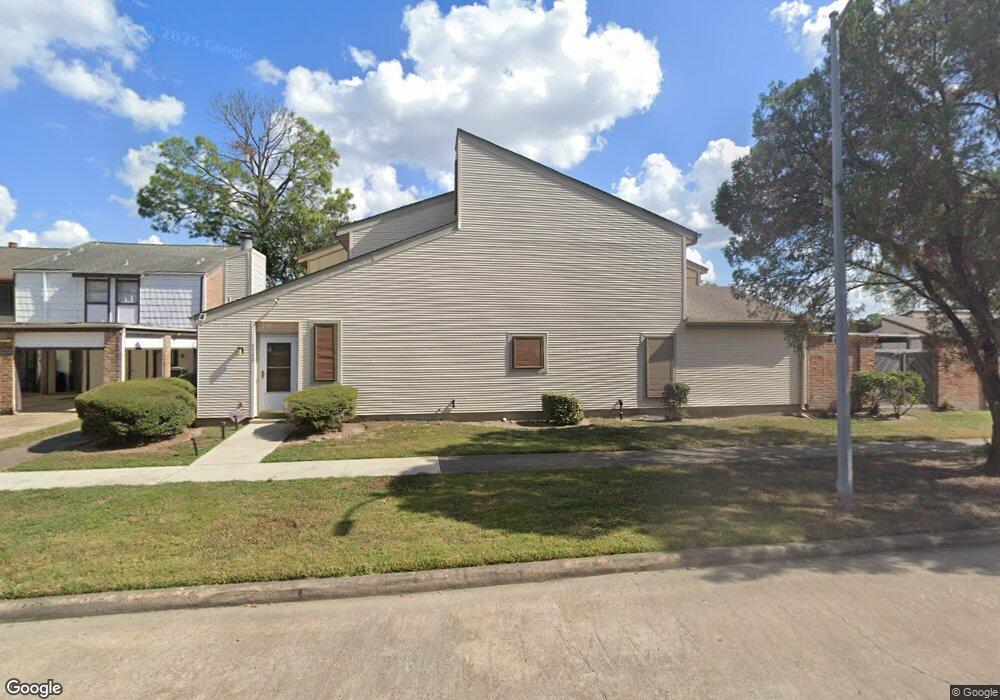
Really cute 2 bedroom with 2.5 baths. all fresh paint and new carpet. large walk in closets in both bedrooms. walk in shower in master. Walk out patio off of the master. 2 covered parking. MASSIVE AVAILABLE STORAGE. ALL APPLIANCES TO INCLUDE REFRIGERATOR AND WASHER AND DRYER
Last Agent to Rent the Property
Pride St. Realty, LLC License #0616179 Listed on: 02/23/2019
Last Renter's Agent
Jennifer Young
Promark Realty Group License #0574163
| Date | Buyer | Sale Price | Title Company |
|---|---|---|---|
| Bismuth Bridge Propco Llc | -- | None Listed On Document | |
| Bay Street Homes Llc | -- | Trujillo & Foster Pllc | |
| Oursbourn Matthew | -- | Fidelity National Title | |
| Boston Brennan Scott | -- | Stewart Title |
| Date | Status | Borrower | Loan Amount |
|---|---|---|---|
| Previous Owner | Oursbourn Matthew | $66,000 | |
| Previous Owner | Boston Brennan Scott | $65,050 |
| Date | Event | Price | List to Sale | Price per Sq Ft |
|---|---|---|---|---|
| 08/18/2024 08/18/24 | Off Market | $1,200 | -- | -- |
| 06/20/2019 06/20/19 | Rented | $1,200 | -14.3% | -- |
| 05/21/2019 05/21/19 | Under Contract | -- | -- | -- |
| 02/23/2019 02/23/19 | For Rent | $1,400 | -- | -- |
| Year | Tax Paid | Tax Assessment Tax Assessment Total Assessment is a certain percentage of the fair market value that is determined by local assessors to be the total taxable value of land and additions on the property. | Land | Improvement |
|---|---|---|---|---|
| 2025 | $3,713 | $153,208 | $29,170 | $124,038 |
| 2024 | $3,713 | $154,177 | $29,170 | $125,007 |
| 2023 | $3,713 | $157,654 | $29,170 | $128,484 |
| 2022 | $3,573 | $140,807 | $23,336 | $117,471 |
| 2021 | $3,004 | $113,315 | $11,668 | $101,647 |
| 2020 | $2,710 | $97,548 | $11,668 | $85,880 |
| 2019 | $2,443 | $84,278 | $11,668 | $72,610 |
| 2018 | $1,082 | $75,341 | $11,668 | $63,673 |
| 2017 | $1,957 | $70,273 | $11,668 | $58,605 |
| 2016 | $1,752 | $62,923 | $11,668 | $51,255 |
| 2015 | $1,625 | $62,923 | $11,668 | $51,255 |
| 2014 | $1,625 | $58,189 | $11,668 | $46,521 |
Landlord's Agent in 2019
Tom Eickleberry
Pride St. Realty, LLC
(713) 201-5257
49 Total Sales
J
Tenant's Agent in 2019
Jennifer Young
Promark Realty Group
Source: Houston Association of REALTORS®
MLS Number: 28021151
APN: 1057160020003
Disclaimer: Certain information contained herein is derived from information provided by parties other than Homes.com. All information provided is deemed reliable, but is not guaranteed to be accurate and should be independently verified.
![]() Copyright 2025, Houston REALTORS® Information Service, Inc.
Copyright 2025, Houston REALTORS® Information Service, Inc.
The information provided is exclusively for consumers’ personal, non-commercial use, and may not be used for any purpose other than to identify prospective properties consumers may be interested in purchasing.
Information is deemed reliable but not guaranteed.