
Landlord's Agent in 2020
LaSamuel Clewis
Exit Realty 360
(832) 898-4452
26 Total Sales
Estimated Value: $156,000 - $193,000
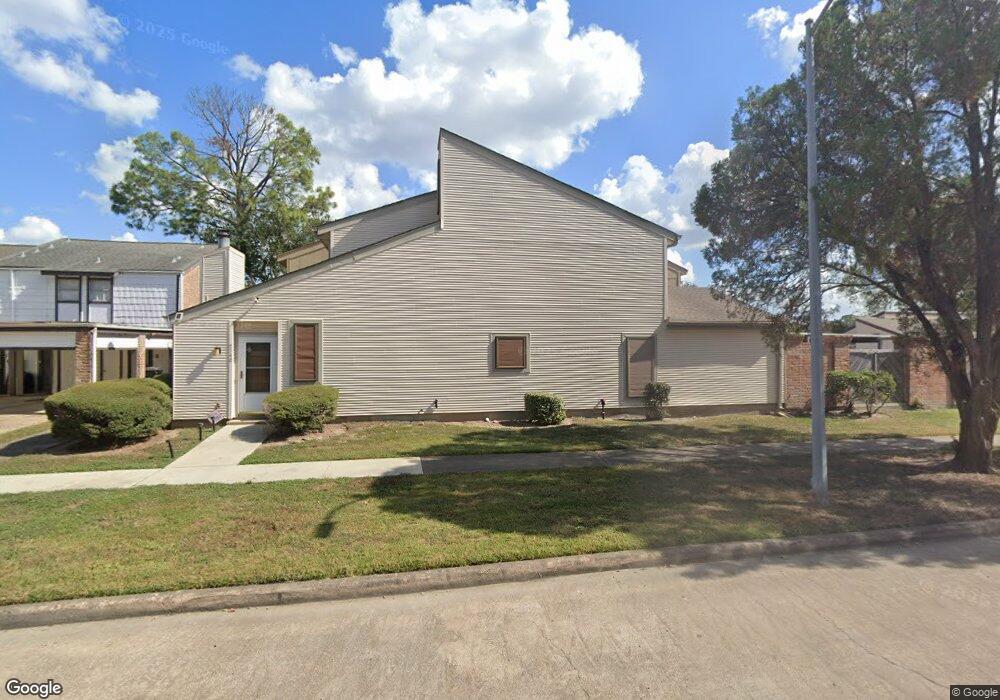
AMAZING TOWNHOUSE TUCKED AWAY IN THE MIDDLE OF INWOOD FOREST SURROUNDED BY TREES AND ON THE GOLF COURSE. LAWN MAINT HOME FEATURES WONDERFUL TALL WINDOWS IN THE LIVING ROOM THAT CONTINUE TO THE MASTER BEDROOM SUITE-TWO NICE SIZE SECONDARY BEDROOMS UPSTAIRS THAT SHARE A BATH.KITCHEN WET BAR AND FIREPLACE AND MUCH MORE.
Last Agent to Rent the Property
Exit Realty 360 License #0654062 Listed on: 05/25/2020
| Date | Buyer | Sale Price | Title Company |
|---|---|---|---|
| Alonso Luis | -- | None Available | |
| Lopez Kenneth Lamar | -- | None Available | |
| Lopez Lisa M | -- | Nat | |
| Saxon Mortgage Services Inc | -- | Nat | |
| Mortgage Electronic Registration Systems | $70,550 | None Available | |
| Porter Gerald J | -- | Houston Title |
| Date | Status | Borrower | Loan Amount |
|---|---|---|---|
| Previous Owner | Porter Gerald J | $66,000 |
| Date | Event | Price | List to Sale | Price per Sq Ft | Prior Sale |
|---|---|---|---|---|---|
| 06/01/2025 06/01/25 | Off Market | $1,500 | -- | -- | |
| 12/31/2021 12/31/21 | Off Market | -- | -- | -- | |
| 06/03/2020 06/03/20 | Rented | $1,500 | +11.1% | -- | |
| 05/25/2020 05/25/20 | For Rent | $1,350 | -10.0% | -- | |
| 05/25/2020 05/25/20 | Rented | $1,500 | 0.0% | -- | |
| 04/16/2019 04/16/19 | Sold | -- | -- | -- | View Prior Sale |
| 03/17/2019 03/17/19 | Pending | -- | -- | -- | |
| 03/06/2019 03/06/19 | For Sale | $65,000 | -- | $34 / Sq Ft |
| Year | Tax Paid | Tax Assessment Tax Assessment Total Assessment is a certain percentage of the fair market value that is determined by local assessors to be the total taxable value of land and additions on the property. | Land | Improvement |
|---|---|---|---|---|
| 2025 | $3,805 | $163,523 | $29,468 | $134,055 |
| 2024 | $3,805 | $157,963 | $29,468 | $128,495 |
| 2023 | $3,805 | $157,963 | $29,468 | $128,495 |
| 2022 | $3,539 | $139,451 | $23,574 | $115,877 |
| 2021 | $2,921 | $110,199 | $11,787 | $98,412 |
| 2020 | $3,059 | $110,089 | $11,787 | $98,302 |
| 2019 | $2,752 | $94,907 | $11,787 | $83,120 |
| 2018 | $1,215 | $84,623 | $11,787 | $72,836 |
| 2017 | $2,195 | $78,819 | $11,787 | $67,032 |
| 2016 | $1,961 | $70,413 | $11,787 | $58,626 |
| 2015 | $1,789 | $70,413 | $11,787 | $58,626 |
| 2014 | $1,789 | $64,058 | $11,787 | $52,271 |
Landlord's Agent in 2020
LaSamuel Clewis
Exit Realty 360
(832) 898-4452
26 Total Sales
K
Tenant's Agent in 2020
Kelley Banks
Coldwell Banker Realty - Heights
(713) 433-5696
59 Total Sales
C
Seller's Agent in 2019
Cary Love
eXp Realty LLC
Buyer's Agent in 2019
Russell Lempertz
RE/MAX Signature
(832) 607-8602
5 in this area
75 Total Sales
Source: Houston Association of REALTORS®
MLS Number: 39329040
APN: 1057160020002
Disclaimer: Certain information contained herein is derived from information provided by parties other than Homes.com. All information provided is deemed reliable, but is not guaranteed to be accurate and should be independently verified.
![]() Copyright 2025, Houston REALTORS® Information Service, Inc.
Copyright 2025, Houston REALTORS® Information Service, Inc.
The information provided is exclusively for consumers’ personal, non-commercial use, and may not be used for any purpose other than to identify prospective properties consumers may be interested in purchasing.
Information is deemed reliable but not guaranteed.