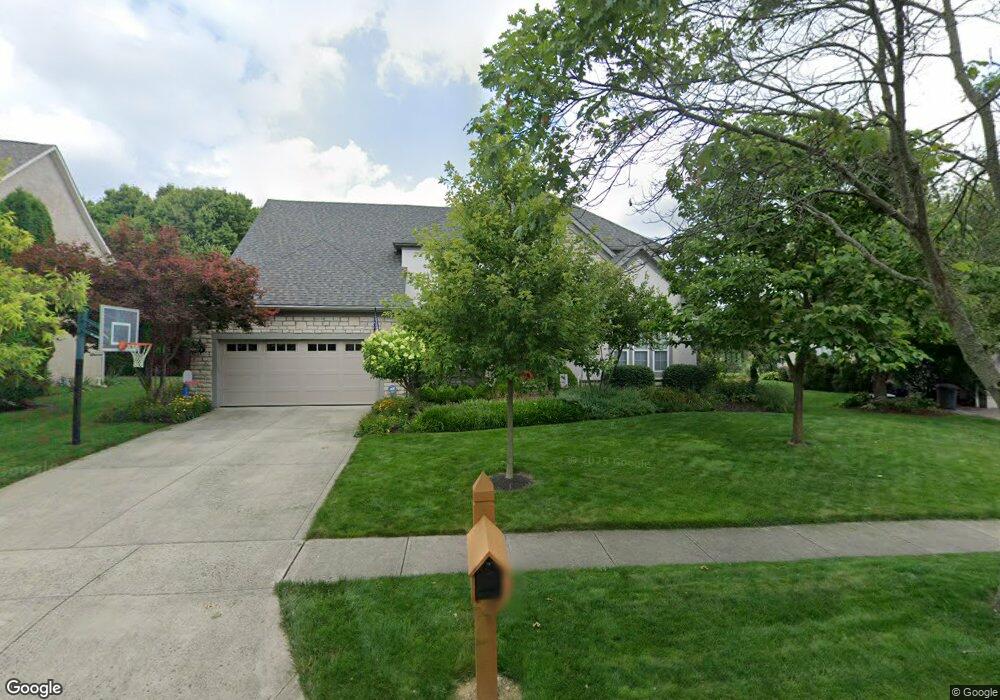
7738 Wryneck Dr Dublin, OH 43017
Estimated Value: $690,000 - $877,000
4
Beds
3
Baths
3,100
Sq Ft
$245/Sq Ft
Est. Value
About This Home
This home is located at 7738 Wryneck Dr, Dublin, OH 43017 and is currently estimated at $759,762, approximately $245 per square foot. 7738 Wryneck Dr is a home located in Franklin County with nearby schools including Wyandot Elementary School, Henry Karrer Middle School, and Dublin Coffman High School.
Ownership History
Date
Name
Owned For
Owner Type
Purchase Details
Closed on
Jun 28, 2021
Sold by
Kuharik Weddington Terri and Kuharik Weddington Living Trus
Bought by
Bennett Terri Lind and Bennett Jeffrey Reed
Current Estimated Value
Purchase Details
Closed on
Dec 4, 2006
Sold by
Kuharik Terri L and Weddington Frederick Lanford
Bought by
Livin Kuharik Weddington Terri and Livin Terri Kuharik Weddington
Purchase Details
Closed on
Oct 19, 2000
Sold by
Akgerman Nuri and Akgerman Belgin B
Bought by
Kuharik Terri L
Home Financials for this Owner
Home Financials are based on the most recent Mortgage that was taken out on this home.
Original Mortgage
$340,000
Interest Rate
7.9%
Purchase Details
Closed on
Mar 15, 1999
Sold by
Fiori Homes Inc
Bought by
Akgerman Nuri and Akgerman Belgin B
Home Financials for this Owner
Home Financials are based on the most recent Mortgage that was taken out on this home.
Original Mortgage
$161,600
Interest Rate
6.85%
Create a Home Valuation Report for This Property
The Home Valuation Report is an in-depth analysis detailing your home's value as well as a comparison with similar homes in the area
Home Values in the Area
Average Home Value in this Area
Purchase History
We collect this data history from publicly available records. To have your information removed, we recommend requesting removal directly through your county’s website.
| Date | Buyer | Sale Price | Title Company |
|---|---|---|---|
| Bennett Terri Lind | -- | Search 2 Close | |
| Livin Kuharik Weddington Terri | -- | Attorney | |
| Kuharik Terri L | $340,000 | Chicago Title West | |
| Akgerman Nuri | $321,700 | Chicago Title |
Source: Public Records
Mortgage History
We collect this data history from publicly available records. To have your information removed, we recommend requesting removal directly through your county’s website.
| Date | Status | Borrower | Loan Amount |
|---|---|---|---|
| Closed | Kuharik Terri L | $340,000 | |
| Previous Owner | Akgerman Nuri | $161,600 |
Source: Public Records
Tax History
| Year | Tax Paid | Tax Assessment Tax Assessment Total Assessment is a certain percentage of the fair market value that is determined by local assessors to be the total taxable value of land and additions on the property. | Land | Improvement |
|---|---|---|---|---|
| 2025 | $13,644 | $210,000 | $49,000 | $161,000 |
| 2024 | $13,644 | $210,000 | $49,000 | $161,000 |
| 2023 | $13,454 | $210,000 | $49,000 | $161,000 |
| 2022 | $11,212 | $159,960 | $30,210 | $129,750 |
| 2021 | $11,239 | $159,960 | $30,210 | $129,750 |
| 2020 | $11,332 | $159,960 | $30,210 | $129,750 |
| 2019 | $11,161 | $139,340 | $26,250 | $113,090 |
| 2018 | $10,856 | $139,340 | $26,250 | $113,090 |
| 2017 | $10,387 | $139,340 | $26,250 | $113,090 |
| 2016 | $10,435 | $131,430 | $26,390 | $105,040 |
| 2015 | $10,502 | $131,430 | $26,390 | $105,040 |
| 2014 | $10,515 | $131,430 | $26,390 | $105,040 |
| 2013 | $5,095 | $125,160 | $25,130 | $100,030 |
Source: Public Records
Map
Nearby Homes
- 9064 Moors Place N
- 7741 Ardaugh Ct
- 7820 Nassau Loop
- 6029 Glenbarr Place
- 7408 Maynooth Dr
- 6200 Wynford Dr
- 6219 Wynford Dr
- 6482 Ringsend Ct
- 6031 Cromdale Dr
- 8212 Shannon Glen Blvd
- 5684 Terre Prince Ct
- 7710 Tullymore Dr
- 8092 Lombard Way
- 5498 Fawnbrook Ln
- 6571 Tully Ct
- 6519 Westbury Dr
- 5410 Haverhill Dr
- 5558 Parker Hill Ln
- 5850 Moray Ct
- 6641 Wisteria Cir
- 7730 Wryneck Dr
- 7744 Wryneck Dr
- 7722 Wryneck Dr
- 7750 Wryneck Dr
- 7735 Wryneck Dr
- 7743 Wryneck Dr
- 7727 Wryneck Dr
- 7714 Wryneck Dr
- 7751 Wryneck Dr
- 7756 Wryneck Dr
- 7715 Wryneck Dr
- 7730 Kestrel Way E
- 7722 Kestrel Way E
- 7722 Kestrel Way W
- 7711 Crossbill Ct
- 7703 Crossbill Ct
- 7706 Wryneck Dr
- 7707 Wryneck Dr
- 7759 Wryneck Dr
- 7738 Kestrel Way E
Your Personal Tour Guide
Ask me questions while you tour the home.