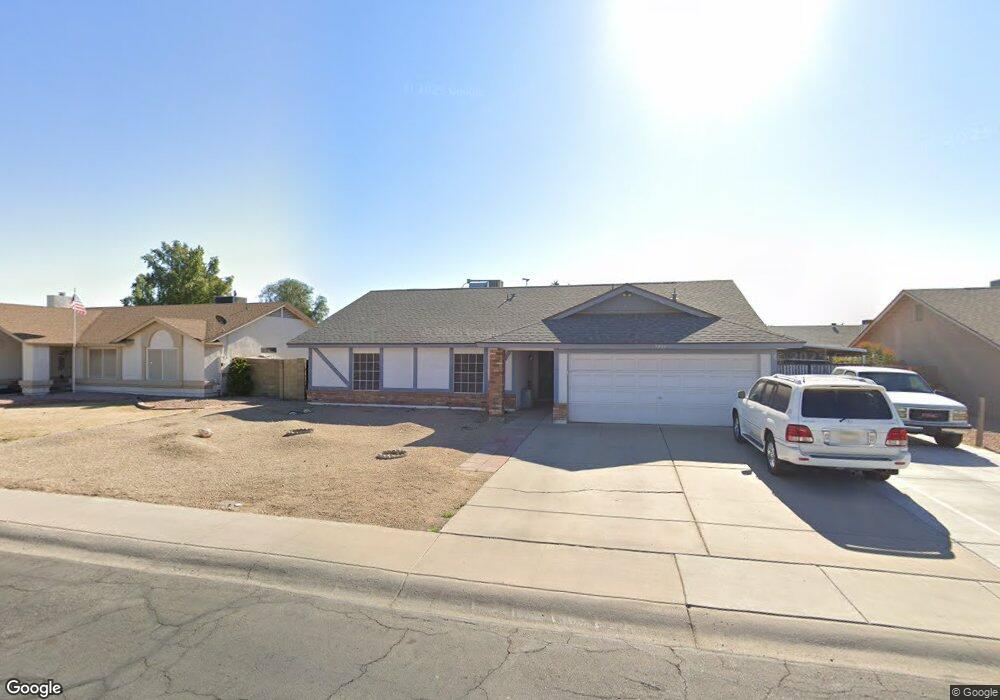
7739 W Shangri la Rd Peoria, AZ 85345
Estimated Value: $359,589 - $438,000
--
Bed
2
Baths
1,950
Sq Ft
$210/Sq Ft
Est. Value
About This Home
This home is located at 7739 W Shangri la Rd, Peoria, AZ 85345 and is currently estimated at $409,897, approximately $210 per square foot. 7739 W Shangri la Rd is a home located in Maricopa County with nearby schools including Peoria Elementary School, Peoria High School, and Academy of Math & Science - Peoria Advanced.
Ownership History
Date
Name
Owned For
Owner Type
Purchase Details
Closed on
Feb 5, 2013
Sold by
Shoecraft Mayo Al
Bought by
Shoecraft Mayo Al
Current Estimated Value
Home Financials for this Owner
Home Financials are based on the most recent Mortgage that was taken out on this home.
Original Mortgage
$113,800
Interest Rate
3.34%
Mortgage Type
New Conventional
Purchase Details
Closed on
Sep 11, 2007
Sold by
Shoecraft Mayo A L
Bought by
Shoecraft Mayo A L and Mayo A L Shoecraft Revocable Trust
Purchase Details
Closed on
Apr 8, 2003
Sold by
Shoecraft Mayo A L
Bought by
Shoecraft Mayo A L
Home Financials for this Owner
Home Financials are based on the most recent Mortgage that was taken out on this home.
Original Mortgage
$137,000
Interest Rate
5.6%
Purchase Details
Closed on
Sep 18, 2001
Sold by
Shoecraft Chong Ye
Bought by
Shoecraft Mayo A L
Create a Home Valuation Report for This Property
The Home Valuation Report is an in-depth analysis detailing your home's value as well as a comparison with similar homes in the area
Home Values in the Area
Average Home Value in this Area
Purchase History
| Date | Buyer | Sale Price | Title Company |
|---|---|---|---|
| Shoecraft Mayo Al | -- | First American Equity Loan S | |
| Shoecraft Mayo A L | -- | None Available | |
| Shoecraft Mayo A L | -- | Fidelity National Title | |
| Shoecraft Mayo A L | -- | -- |
Source: Public Records
Mortgage History
| Date | Status | Borrower | Loan Amount |
|---|---|---|---|
| Closed | Shoecraft Mayo Al | $113,800 | |
| Closed | Shoecraft Mayo A L | $137,000 |
Source: Public Records
Tax History Compared to Growth
Tax History
| Year | Tax Paid | Tax Assessment Tax Assessment Total Assessment is a certain percentage of the fair market value that is determined by local assessors to be the total taxable value of land and additions on the property. | Land | Improvement |
|---|---|---|---|---|
| 2025 | $1,412 | $18,644 | -- | -- |
| 2024 | $1,430 | $17,757 | -- | -- |
| 2023 | $1,430 | $31,660 | $6,330 | $25,330 |
| 2022 | $1,400 | $24,570 | $4,910 | $19,660 |
| 2021 | $1,499 | $22,550 | $4,510 | $18,040 |
| 2020 | $1,513 | $21,110 | $4,220 | $16,890 |
| 2019 | $1,464 | $19,310 | $3,860 | $15,450 |
| 2018 | $1,415 | $18,110 | $3,620 | $14,490 |
| 2017 | $1,416 | $17,310 | $3,460 | $13,850 |
| 2016 | $1,402 | $17,180 | $3,430 | $13,750 |
| 2015 | $1,308 | $16,760 | $3,350 | $13,410 |
Source: Public Records
Map
Nearby Homes
- 11231 N 77th Dr
- 11221 N 77th Ave
- 10955 N 79th Ave Unit 163
- 10955 N 79th Ave Unit 113
- 10955 N 79th Ave Unit 60
- 10955 N 79th Ave Unit 40
- 10955 N 79th Ave Unit 179
- 10955 N 79th Ave Unit 147
- 7920 W Greer Ave
- 11507 N 79th Dr
- 11535 N 79th Dr Unit 2
- 7810 W Peoria Ave Unit 174
- 7810 W Peoria Ave Unit 79
- 7810 W Peoria Ave Unit 121
- 7810 W Peoria Ave Unit 74
- 7810 W Peoria Ave Unit 98
- 7810 W Peoria Ave Unit 166
- 7810 W Peoria Ave Unit 85
- 7545 W Jenan Dr
- 11320 N 80th Dr
- 7733 W Shangri la Rd
- 7745 W Shangri la Rd
- 7738 W Mescal St
- 7732 W Mescal St
- 7744 W Mescal St
- 7803 W Shangri la Rd
- 7727 W Shangri la Rd
- 7738 W Shangri la Rd
- 7744 W Shangri la Rd
- 7732 W Shangri la Rd
- 7726 W Mescal St
- 7802 W Mescal St
- 7802 W Shangri la Rd
- 7726 W Shangri la Rd
- 7809 W Shangri la Rd
- 7809 W Shangri la Rd
- 7739 W Yucca St
- 7739 W Mescal St
- 7808 W Shangri la Rd
- 7733 W Mescal St