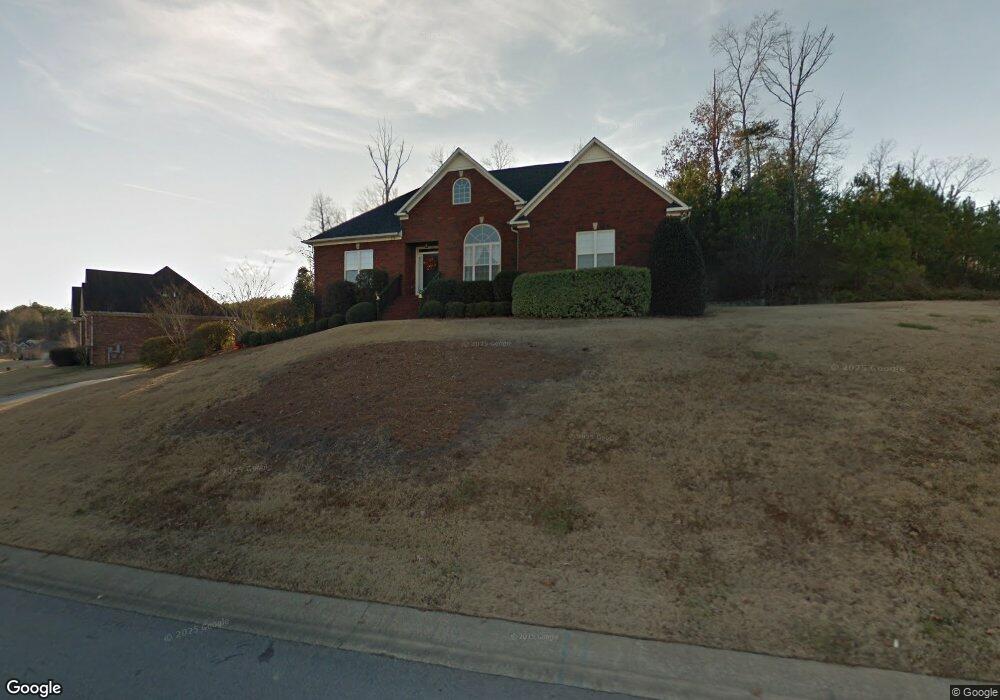
774 Cluster Springs Rd Gardendale, AL 35071
Estimated Value: $354,000 - $381,924
3
Beds
3
Baths
1,964
Sq Ft
$189/Sq Ft
Est. Value
About This Home
This home is located at 774 Cluster Springs Rd, Gardendale, AL 35071 and is currently estimated at $370,231, approximately $188 per square foot. 774 Cluster Springs Rd is a home located in Jefferson County with nearby schools including Gardendale Elementary School, Bragg Middle School, and Gardendale High School.
Ownership History
Date
Name
Owned For
Owner Type
Purchase Details
Closed on
May 24, 2002
Sold by
Don Alexander Construction Inc
Bought by
Estes Jeff A and Estes Melissa J
Current Estimated Value
Purchase Details
Closed on
Jan 18, 2000
Sold by
Alexander Jerrel Don
Bought by
Don Alexander Construction Inc
Home Financials for this Owner
Home Financials are based on the most recent Mortgage that was taken out on this home.
Original Mortgage
$170,000
Outstanding Balance
$54,135
Interest Rate
7.87%
Mortgage Type
Credit Line Revolving
Estimated Equity
$316,096
Purchase Details
Closed on
Nov 29, 1999
Sold by
Woodbury Forest Llc
Bought by
Alexander Jerrel Don
Home Financials for this Owner
Home Financials are based on the most recent Mortgage that was taken out on this home.
Original Mortgage
$170,000
Outstanding Balance
$54,135
Interest Rate
7.87%
Mortgage Type
Credit Line Revolving
Estimated Equity
$316,096
Create a Home Valuation Report for This Property
The Home Valuation Report is an in-depth analysis detailing your home's value as well as a comparison with similar homes in the area
Home Values in the Area
Average Home Value in this Area
Purchase History
| Date | Buyer | Sale Price | Title Company |
|---|---|---|---|
| Estes Jeff A | $205,000 | Cahaba Title Inc | |
| Don Alexander Construction Inc | -- | Alabama Title Co Inc | |
| Alexander Jerrel Don | $19,400 | -- |
Source: Public Records
Mortgage History
| Date | Status | Borrower | Loan Amount |
|---|---|---|---|
| Open | Don Alexander Construction Inc | $170,000 |
Source: Public Records
Tax History Compared to Growth
Tax History
| Year | Tax Paid | Tax Assessment Tax Assessment Total Assessment is a certain percentage of the fair market value that is determined by local assessors to be the total taxable value of land and additions on the property. | Land | Improvement |
|---|---|---|---|---|
| 2024 | $1,850 | $34,220 | -- | -- |
| 2022 | $1,548 | $26,640 | $3,900 | $22,740 |
| 2021 | $1,305 | $22,600 | $3,900 | $18,700 |
| 2020 | $1,296 | $22,430 | $3,900 | $18,530 |
| 2019 | $1,193 | $20,740 | $0 | $0 |
| 2018 | $1,228 | $21,320 | $0 | $0 |
| 2017 | $1,276 | $22,120 | $0 | $0 |
| 2016 | $1,270 | $22,020 | $0 | $0 |
| 2015 | $1,219 | $21,160 | $0 | $0 |
| 2014 | $1,044 | $21,180 | $0 | $0 |
| 2013 | $1,044 | $21,180 | $0 | $0 |
Source: Public Records
Map
Nearby Homes
- 118 Cluster Springs Cir
- 165 Cluster Springs Cir
- 873 Fieldstown Cir
- 890 Fieldstown Cir
- 4515 Shady Grove Ln Unit 2
- 4848 Cornelius Dr
- 709 Odum Rd
- 4555 Eldorado Dr
- 4507 Shady Grove Rd
- 4436 Shady Grove Rd Unit 16n
- 658 Odum Rd
- 4723 Crestview Dr
- 4681 Northridge Dr
- 716 Kerr Dr
- 4674 Northridge Dr
- 1255 Mountain Ln
- 5190 Memory Ln
- 4362 Shivas Way Unit 238
- 4358 Shivas Way Unit 239
- 4354 Shivas Way Unit 240
- 771 Cluster Springs Rd
- 770 Cluster Springs Rd
- 775 Cluster Springs Rd
- 779 Cluster Springs Rd
- 767 Cluster Springs Rd
- 783 Cluster Springs Rd
- 762 Cluster Springs Rd
- 786 Cluster Springs Rd
- 143 Cluster Springs Cir
- 105 Cluster Springs Cir
- 794 Cluster Springs Rd
- 139 Cluster Springs Cir
- 787 Cluster Springs Rd
- 109 Cluster Springs Cir
- 147 Cluster Springs Cir
- 129 Cluster Springs Cir
- 113 Cluster Springs Cir
- 153 Cluster Springs Cir
- 123 Cluster Springs Cir
- 758 Cluster Springs Rd