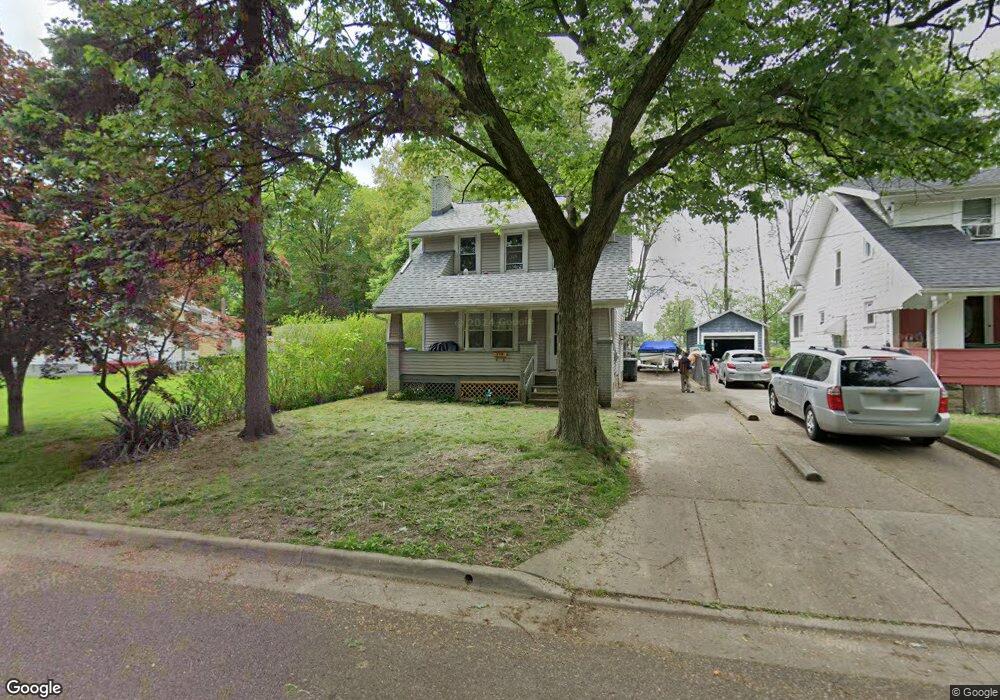
774 Phoenix Ave Akron, OH 44310
North Hill NeighborhoodEstimated Value: $104,671 - $158,000
3
Beds
1
Bath
1,056
Sq Ft
$118/Sq Ft
Est. Value
About This Home
This home is located at 774 Phoenix Ave, Akron, OH 44310 and is currently estimated at $124,668, approximately $118 per square foot. 774 Phoenix Ave is a home located in Summit County with nearby schools including North High School, Edge Academy, The, and Steel Academy.
Ownership History
Date
Name
Owned For
Owner Type
Purchase Details
Closed on
Oct 29, 2019
Sold by
Kanatzar Joseph
Bought by
Cook Kevin
Current Estimated Value
Purchase Details
Closed on
Feb 13, 2008
Sold by
Federal Home Loan Mortgage Corporation
Bought by
Kanatzar Joseph
Purchase Details
Closed on
Apr 27, 2007
Sold by
Wingler Gregory
Bought by
Federal Home Loan Mortgage Corporation
Purchase Details
Closed on
Jul 14, 2000
Sold by
Vellequette Murlin J & Joan L Trustees
Bought by
Wingler Gregory C and Wingler Virginia A
Home Financials for this Owner
Home Financials are based on the most recent Mortgage that was taken out on this home.
Original Mortgage
$56,500
Interest Rate
8.31%
Purchase Details
Closed on
Jul 29, 1994
Sold by
Akron One Properties Ltd
Bought by
Vellequette Famity Trust
Create a Home Valuation Report for This Property
The Home Valuation Report is an in-depth analysis detailing your home's value as well as a comparison with similar homes in the area
Home Values in the Area
Average Home Value in this Area
Purchase History
| Date | Buyer | Sale Price | Title Company |
|---|---|---|---|
| Cook Kevin | $21,400 | None Available | |
| Kanatzar Joseph | -- | Attorney | |
| Federal Home Loan Mortgage Corporation | $46,000 | None Available | |
| Wingler Gregory C | $56,500 | Title One Agency Inc | |
| Vellequette Famity Trust | $43,500 | -- |
Source: Public Records
Mortgage History
| Date | Status | Borrower | Loan Amount |
|---|---|---|---|
| Previous Owner | Wingler Gregory C | $56,500 |
Source: Public Records
Tax History
| Year | Tax Paid | Tax Assessment Tax Assessment Total Assessment is a certain percentage of the fair market value that is determined by local assessors to be the total taxable value of land and additions on the property. | Land | Improvement |
|---|---|---|---|---|
| 2024 | $1,496 | $27,248 | $6,465 | $20,783 |
| 2023 | $2,266 | $27,248 | $6,465 | $20,783 |
| 2022 | $1,466 | $20,962 | $4,974 | $15,988 |
| 2021 | $1,467 | $20,962 | $4,974 | $15,988 |
| 2020 | $1,546 | $20,960 | $4,970 | $15,990 |
| 2019 | $1,467 | $19,330 | $4,770 | $14,560 |
| 2018 | $1,448 | $19,330 | $4,770 | $14,560 |
| 2017 | $1,471 | $19,330 | $4,770 | $14,560 |
| 2016 | $1,472 | $19,330 | $4,770 | $14,560 |
| 2015 | $1,471 | $19,330 | $4,770 | $14,560 |
| 2014 | $1,459 | $19,330 | $4,770 | $14,560 |
| 2013 | $1,394 | $18,820 | $4,770 | $14,050 |
Source: Public Records
Map
Nearby Homes
- 914 Dan St
- 683 Ranney St
- 508 E Tallmadge Ave
- 973 Nevin St
- 559 Patterson Ave
- 614 Parkview Ave
- 894 Argonne Ave
- 660 Hollibaugh Ave
- 495 Delmar Ave
- 225 Cranz Place
- 1068 Easton Dr
- 1167 Hilltop Dr
- 1193 Easton Dr
- 311 Dean St
- 1243 Gorge Blvd
- 230 Helen Ave
- 392 Turner St
- 1420 Home Ave
- 594 Blaine Ave
- 180 Elizabeth Pkwy
- 778 Phoenix Ave
- 782 Phoenix Ave
- 575 E Glenwood Ave
- Lot #17 Phoenix Ave
- 557 E Glenwood Ave
- 786 Phoenix Ave Unit 1
- 786 Phoenix Ave
- 785 Phoenix Ave
- 553 E Glenwood Ave
- 790 Phoenix Ave
- 791 Phoenix Ave
- 549 E Glenwood Ave
- Lot #19 Phoenix Ave
- 580 E Glenwood Ave
- 795 Phoenix Ave
- 570 E Glenwood Ave
- 591 E Glenwood Ave
- 798 Phoenix Ave
- 760 Ranney St
- 790 Ranney St
Your Personal Tour Guide
Ask me questions while you tour the home.