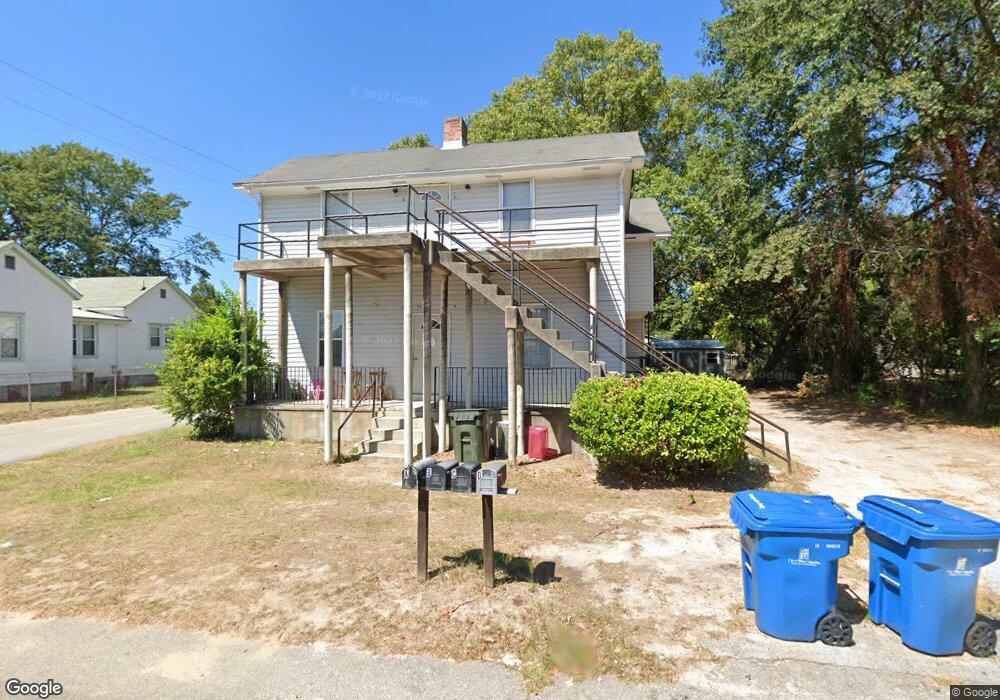
774 Shull St West Columbia, SC 29169
Estimated Value: $194,000 - $233,000
6
Beds
4
Baths
2,715
Sq Ft
$81/Sq Ft
Est. Value
About This Home
This home is located at 774 Shull St, West Columbia, SC 29169 and is currently estimated at $219,333, approximately $80 per square foot. 774 Shull St is a home located in Lexington County with nearby schools including Saluda River Academy For The Arts, Cyril B. Busbee Creative Arts Academy, and Brookland-Cayce High School.
Ownership History
Date
Name
Owned For
Owner Type
Purchase Details
Closed on
Aug 24, 2021
Sold by
Lawer Clyde and Lawer Christine
Bought by
K & P Investments Of Lexington Llc
Current Estimated Value
Home Financials for this Owner
Home Financials are based on the most recent Mortgage that was taken out on this home.
Original Mortgage
$270,000
Outstanding Balance
$168,780
Interest Rate
2.8%
Mortgage Type
Credit Line Revolving
Estimated Equity
$50,553
Create a Home Valuation Report for This Property
The Home Valuation Report is an in-depth analysis detailing your home's value as well as a comparison with similar homes in the area
Home Values in the Area
Average Home Value in this Area
Purchase History
| Date | Buyer | Sale Price | Title Company |
|---|---|---|---|
| K & P Investments Of Lexington Llc | $170,000 | None Available |
Source: Public Records
Mortgage History
| Date | Status | Borrower | Loan Amount |
|---|---|---|---|
| Open | K & P Investments Of Lexington Llc | $270,000 |
Source: Public Records
Tax History Compared to Growth
Tax History
| Year | Tax Paid | Tax Assessment Tax Assessment Total Assessment is a certain percentage of the fair market value that is determined by local assessors to be the total taxable value of land and additions on the property. | Land | Improvement |
|---|---|---|---|---|
| 2024 | $3,393 | $7,878 | $3,054 | $4,824 |
| 2023 | $3,111 | $10,200 | $3,954 | $6,246 |
| 2022 | $3,813 | $10,200 | $3,954 | $6,246 |
| 2020 | $2,598 | $7,328 | $3,678 | $3,650 |
| 2019 | $2,281 | $6,372 | $3,488 | $2,884 |
| 2018 | $2,262 | $6,372 | $3,488 | $2,884 |
| 2017 | $2,220 | $6,372 | $3,488 | $2,884 |
| 2016 | $2,246 | $6,371 | $3,488 | $2,883 |
| 2014 | $1,697 | $5,540 | $2,197 | $3,343 |
| 2013 | -- | $5,540 | $2,200 | $3,340 |
Source: Public Records
Map
Nearby Homes
- 706 Violet St
- 908 B Ave
- 1028 Augusta St
- 515 Center St
- 214 Saint Anns Alley
- 502A Koon St
- 101 Shuler St
- 1011 D Ave
- 100 River Flow Ct
- 120 River Flow Ct
- 1235 Jensen St
- 103 Chicorana Rd
- Tract 1 Hallelujah Rd
- 324 N Parson St
- 1224 Evergreen Ave
- 918 N Lucas St
- 3 Lynnwood Rd
- 816 Fontanna Ave
- 638 Carrington Dr
- 928 Indigo Ave