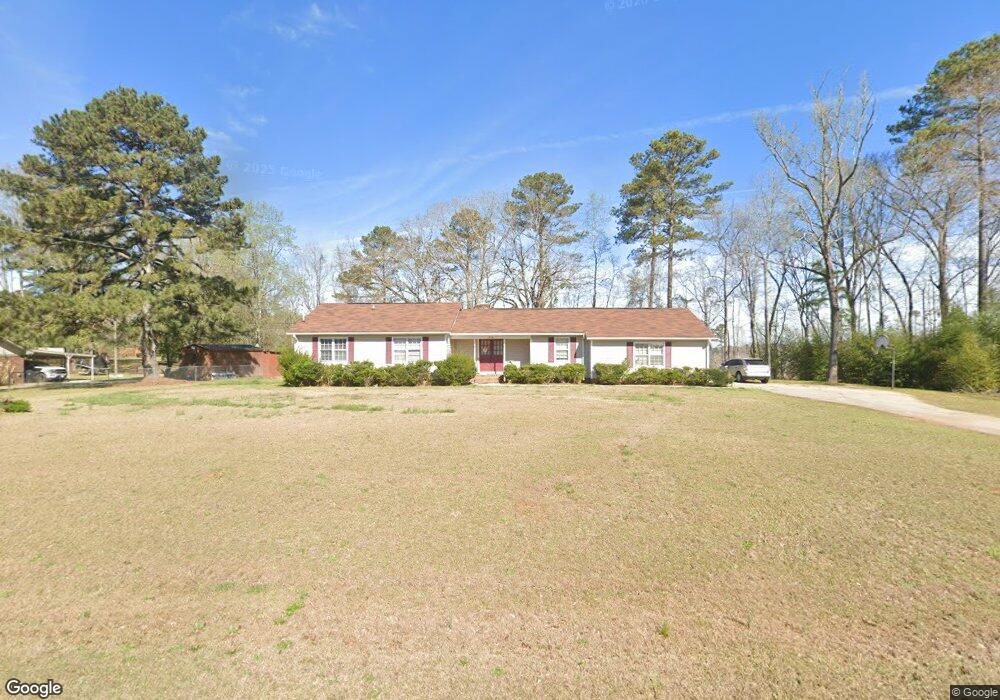
774 Vernon Ferry Rd Lagrange, GA 30240
Estimated Value: $265,000 - $281,000
3
Beds
2
Baths
1,932
Sq Ft
$141/Sq Ft
Est. Value
About This Home
This home is located at 774 Vernon Ferry Rd, Lagrange, GA 30240 and is currently estimated at $272,438, approximately $141 per square foot. 774 Vernon Ferry Rd is a home located in Troup County with nearby schools including Ethel W. Kight Elementary School, Hollis Hand Elementary School, and Franklin Forest Elementary School.
Ownership History
Date
Name
Owned For
Owner Type
Purchase Details
Closed on
Jun 24, 2016
Sold by
Weathers Martha Howell
Bought by
Weathers Willie Grover
Current Estimated Value
Purchase Details
Closed on
Aug 14, 1996
Sold by
Willie G Weathers
Bought by
Weathers Martha
Purchase Details
Closed on
Jan 18, 1996
Sold by
Hisham R A Abu-Baker
Bought by
Willie G Weathers
Purchase Details
Closed on
Aug 3, 1990
Sold by
Abu-Baker Hisham R A
Bought by
Hisham R A Abu-Baker
Purchase Details
Closed on
Aug 7, 1989
Sold by
John Dennis Dodson Et-Al
Bought by
Abu-Baker Hisham R A
Purchase Details
Closed on
Aug 1, 1986
Sold by
Janice Russell and Janice Grizzle
Bought by
John Dennis Dodson Et-Al
Purchase Details
Closed on
Jun 1, 1981
Sold by
Ray Adams
Bought by
Janice Russell and Janice Grizzle
Purchase Details
Closed on
Oct 28, 1975
Bought by
Ray Adams
Create a Home Valuation Report for This Property
The Home Valuation Report is an in-depth analysis detailing your home's value as well as a comparison with similar homes in the area
Home Values in the Area
Average Home Value in this Area
Purchase History
| Date | Buyer | Sale Price | Title Company |
|---|---|---|---|
| Weathers Willie Grover | -- | -- | |
| Weathers Martha | -- | -- | |
| Willie G Weathers | $70,000 | -- | |
| Hisham R A Abu-Baker | -- | -- | |
| Abu-Baker Hisham R A | $77,000 | -- | |
| John Dennis Dodson Et-Al | $72,000 | -- | |
| Janice Russell | $55,000 | -- | |
| Ray Adams | -- | -- |
Source: Public Records
Tax History Compared to Growth
Tax History
| Year | Tax Paid | Tax Assessment Tax Assessment Total Assessment is a certain percentage of the fair market value that is determined by local assessors to be the total taxable value of land and additions on the property. | Land | Improvement |
|---|---|---|---|---|
| 2024 | $1,875 | $68,760 | $14,000 | $54,760 |
| 2023 | $1,760 | $64,520 | $10,000 | $54,520 |
| 2022 | $1,633 | $58,520 | $8,000 | $50,520 |
| 2021 | $1,619 | $53,680 | $8,000 | $45,680 |
| 2020 | $1,619 | $53,680 | $8,000 | $45,680 |
| 2019 | $1,530 | $50,720 | $8,000 | $42,720 |
| 2018 | $1,466 | $48,600 | $8,000 | $40,600 |
| 2017 | $1,466 | $48,600 | $8,000 | $40,600 |
| 2016 | $1,338 | $44,370 | $8,000 | $36,370 |
| 2015 | $1,087 | $35,974 | $4,800 | $31,174 |
| 2014 | $1,039 | $34,334 | $4,800 | $29,534 |
| 2013 | -- | $36,261 | $4,800 | $31,461 |
Source: Public Records
Map
Nearby Homes
- 709 Vernon Ferry Rd
- 883 Vernon Ferry Rd
- 103 Dogwood Ct
- 104 Dogwood Point
- 207 Lakeshore Way
- 0 Deming St Unit 10550189
- 226 Linda Ln
- 150 N Lake Dr
- 4004 White Oak Ln
- 3010 White Oak Ct
- LOT 4 Angela Dr
- 135 Planters Ridge Dr
- E Angela Dr
- 107 Heatherbrook Dr
- 100 Huntcliff Ct
- 124 Foxdale Dr
- 101 Planters Ridge Dr Unit LOT 13
- 190 Hill Rd
- 116 Highland Pointe Dr
- 200 Cheyenne Dr
- 786 Vernon Ferry Rd
- 763 Vernon Ferry Rd
- 791 Vernon Ferry Rd
- 800 Vernon Ferry Rd
- 116 Paddle Wheel Dr
- 100 Vernon Ferry Ct
- 100 Vernon Ferry Ct
- 815 Vernon Ferry Rd
- 114 Paddle Wheel Dr
- 0 Paddlewheel Dr Unit 7400995
- 0 Paddlewheel Dr Unit 7406365
- 0 Paddlewheel Dr Unit 7018544
- 102 Vernon Ferry Ct
- 0 Vernon Ferry Ct Unit 7274401
- 0 Vernon Ferry Ct Unit 7163326
- 824 Vernon Ferry Rd
- 113 Paddle Wheel Dr
- 835 Vernon Ferry Rd
- 104 Vernon Ferry Ct
- 101 Vernon Ferry Ct