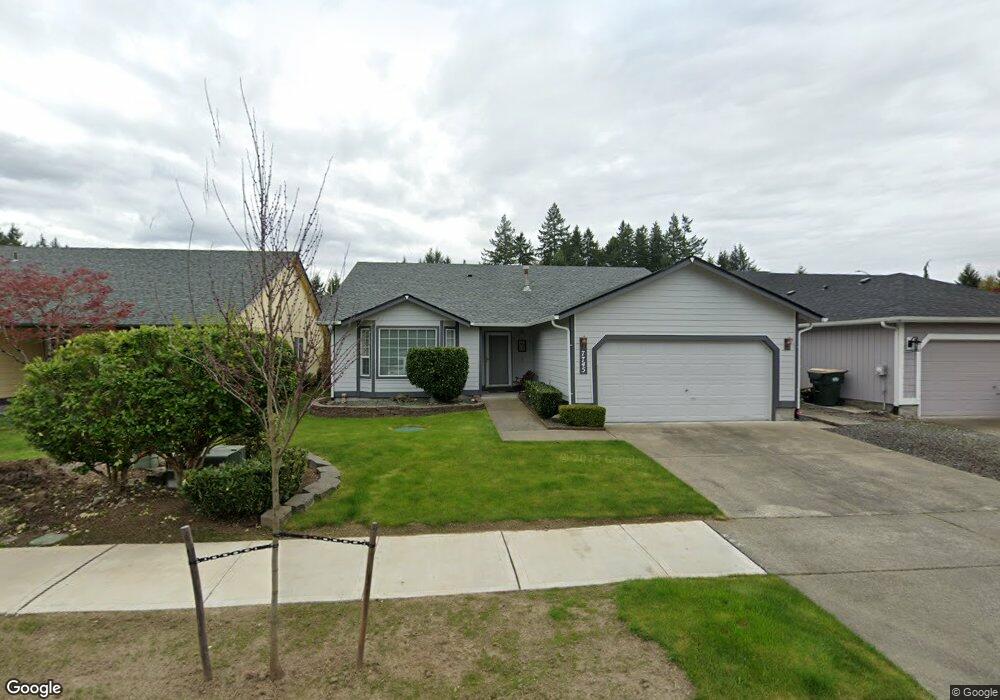
7745 48th Loop SE Lacey, WA 98503
The Lakes NeighborhoodEstimated Value: $476,596 - $507,000
3
Beds
2
Baths
1,732
Sq Ft
$283/Sq Ft
Est. Value
About This Home
This home is located at 7745 48th Loop SE, Lacey, WA 98503 and is currently estimated at $489,899, approximately $282 per square foot. 7745 48th Loop SE is a home located in Thurston County with nearby schools including Woodland Elementary School, Komachin Middle School, and Timberline High School.
Ownership History
Date
Name
Owned For
Owner Type
Purchase Details
Closed on
Mar 13, 2010
Sold by
Her Eun Seock
Bought by
Pak Sun Young
Current Estimated Value
Home Financials for this Owner
Home Financials are based on the most recent Mortgage that was taken out on this home.
Original Mortgage
$220,924
Outstanding Balance
$142,399
Interest Rate
4.75%
Mortgage Type
FHA
Estimated Equity
$347,500
Purchase Details
Closed on
Aug 24, 2004
Sold by
Davis Vaun C and Davis Michael E
Bought by
Lontai Joseph E
Home Financials for this Owner
Home Financials are based on the most recent Mortgage that was taken out on this home.
Original Mortgage
$213,598
Interest Rate
5%
Mortgage Type
VA
Purchase Details
Closed on
Mar 10, 1999
Sold by
Deering & Nelson Inc
Bought by
Davis Michael E and Davis Vaun C
Home Financials for this Owner
Home Financials are based on the most recent Mortgage that was taken out on this home.
Original Mortgage
$119,475
Interest Rate
6.7%
Mortgage Type
VA
Create a Home Valuation Report for This Property
The Home Valuation Report is an in-depth analysis detailing your home's value as well as a comparison with similar homes in the area
Home Values in the Area
Average Home Value in this Area
Purchase History
| Date | Buyer | Sale Price | Title Company |
|---|---|---|---|
| Pak Sun Young | -- | Chicago Title Company | |
| Pak Sun Young | $225,000 | Chicago Title Company | |
| Lontai Joseph E | $209,000 | Stewart Title Of Western | |
| Davis Michael E | $134,000 | Transnation Title Insurance |
Source: Public Records
Mortgage History
| Date | Status | Borrower | Loan Amount |
|---|---|---|---|
| Open | Pak Sun Young | $220,924 | |
| Previous Owner | Lontai Joseph E | $213,598 | |
| Previous Owner | Davis Michael E | $119,475 |
Source: Public Records
Tax History
| Year | Tax Paid | Tax Assessment Tax Assessment Total Assessment is a certain percentage of the fair market value that is determined by local assessors to be the total taxable value of land and additions on the property. | Land | Improvement |
|---|---|---|---|---|
| 2025 | $4,074 | $463,000 | $135,300 | $327,700 |
| 2024 | $4,074 | $448,000 | $130,100 | $317,900 |
| 2023 | $4,074 | $426,000 | $108,800 | $317,200 |
| 2022 | $3,957 | $405,100 | $68,200 | $336,900 |
| 2021 | $3,446 | $340,000 | $76,100 | $263,900 |
| 2020 | $3,202 | $275,800 | $70,200 | $205,600 |
| 2019 | $2,441 | $266,200 | $62,700 | $203,500 |
| 2018 | $2,660 | $198,000 | $59,100 | $138,900 |
| 2017 | $2,444 | $191,600 | $36,500 | $155,100 |
| 2016 | $2,345 | $187,200 | $37,000 | $150,200 |
| 2014 | -- | $179,300 | $37,000 | $142,300 |
Source: Public Records
Map
Nearby Homes
- 7925 Mullen Rd SE
- 7438 Mullen Rd SE Unit A-B
- 7604 Brianna Ct SE
- 4201 Arbor Ct SE
- 7305 49th Ave SE
- 5401 Carpenter Rd SE
- 4605 Timberline Dr SE
- 4205 Candlewood Dr SE
- 5609 Henslin Dr SE
- 8325 48th Ct SE
- 8242 55th Ave SE
- 7111 41st Ave SE
- 3901 Long Lake Dr SE
- 5218 Pattison Lake Ln SE
- 6934 43rd Loop SE
- 5117 Rumac St SE
- 5519 Pattison Lake Ln SE
- 3300 Carpenter Rd SE Unit 107
- 3300 Carpenter Rd SE Unit 100
- 3806 Southlake Dr SE
- 7737 48th Loop SE
- 7753 48th Loop SE
- 7734 48th Ave SE
- 7761 48th Loop SE
- 7742 48th Ave SE
- 7732 48th Loop SE
- 7740 Sawgrass Ln SE
- 7746 48th Ave SE
- 7769 48th Loop SE
- 7760 Sawgrass Ln SE
- 7728 48th Loop SE
- 7736 48th Loop SE
- 7724 48th Loop SE
- 7738 48th Ave SE
- 7750 48th Ave SE
- 7801 48th Loop SE
- 7756 Sawgrass Ln SE
- 7748 Sawgrass Ln SE
- 7800 48th Ave SE
- 7802 Redwing Ln SE
Your Personal Tour Guide
Ask me questions while you tour the home.