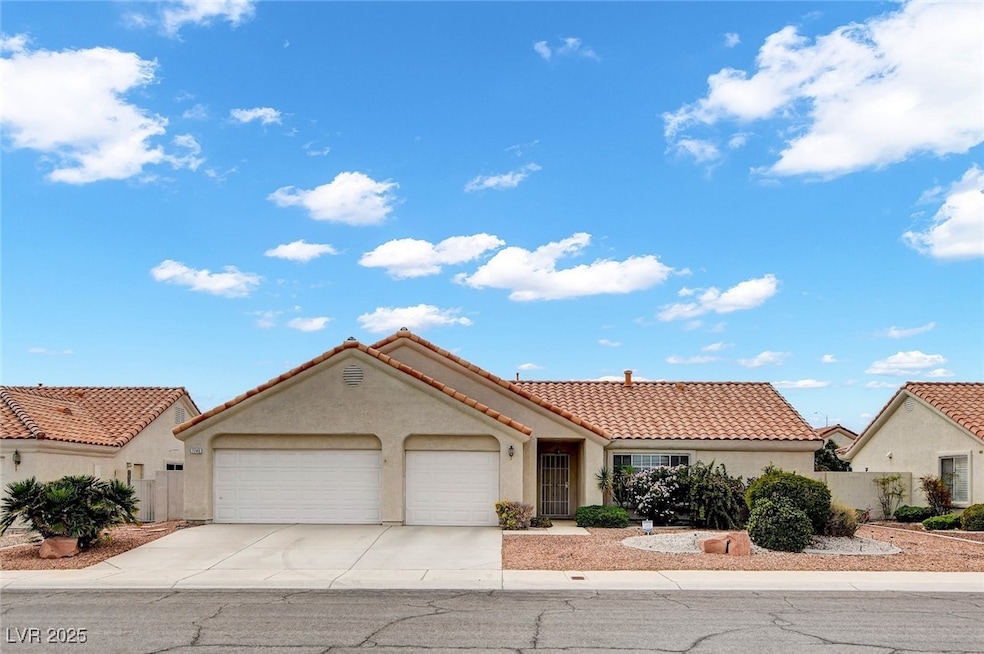
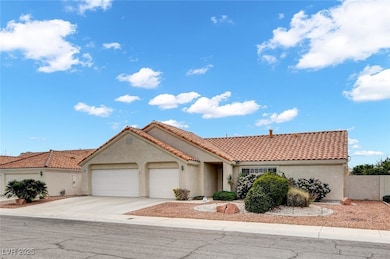
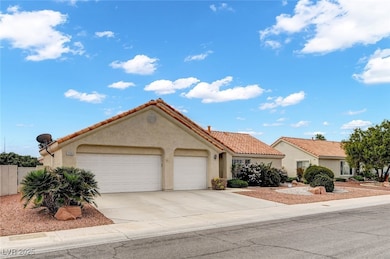
7745 Safari Ln Las Vegas, NV 89129
Lone Mountain NeighborhoodEstimated payment $2,674/month
Highlights
- Very Popular Property
- Vaulted Ceiling
- Double Oven
- In Ground Pool
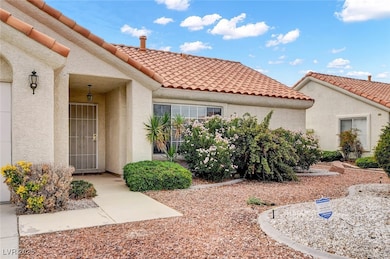
- Covered Patio or Porch
- 3 Car Attached Garage
About This Home
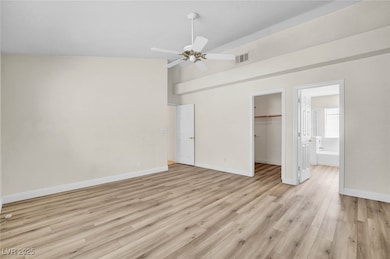
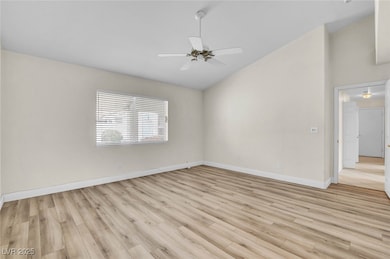
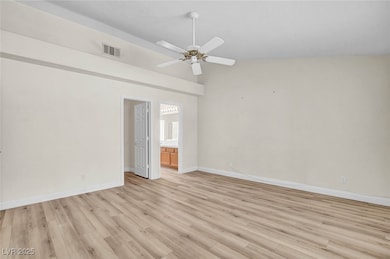
This single-story gem offers 3 bedrooms, 2 full baths. Soaring vaulted ceilings. Airy floorplan with tons of natural light. New flooring in the primary bed and bath as well. New carpet in the additional beds & living spaces. Cozy up to the dual sided gas fireplace open to the family as well as the living/dining spaces. Step outside to the covered patio for effortless indoor-outdoor living. The kitchen and both baths feature classic tile countertops, timeless and easy-care, all steps away from the charming rear-covered patio that is perfect for morning coffee or cooking & entertaining family & friends next to the sparkling inground pool. Enjoy a spacious 3-car garage with built-in cabinets & backyard access. ALL tucked on a quiet interior 7,800+ SF parcel, that offers a ton of unused space. Recently replace AC condenser for the sale of the home. This home is waiting for your personal touches.
Listing Agent
Keller Williams MarketPlace Brokerage Phone: (702) 285-7659 License #S.0069141 Listed on: 12/08/2025

Home Details
Home Type
- Single Family
Est. Annual Taxes
- $2,560
Year Built
- Built in 1994
Lot Details
- 7,841 Sq Ft Lot
- North Facing Home
- Back Yard Fenced
- Block Wall Fence
- Desert Landscape
HOA Fees
- $15 Monthly HOA Fees
Parking
- 3 Car Attached Garage
- Parking Storage or Cabinetry
- Inside Entrance
- Garage Door Opener
Home Design
- Pitched Roof
- Tile Roof
Interior Spaces
- 1,701 Sq Ft Home
- 1-Story Property
- Furnished or left unfurnished upon request
- Vaulted Ceiling
- Ceiling Fan
- Double Sided Fireplace
- Gas Fireplace
- Window Treatments
- Family Room with Fireplace
- Living Room with Fireplace
Kitchen
- Double Oven
- Built-In Gas Oven
- Microwave
- Pots and Pans Drawers
- Disposal
Flooring
- Carpet
- Ceramic Tile
Bedrooms and Bathrooms
- 3 Bedrooms
- 2 Full Bathrooms
Laundry
- Laundry on main level
- Dryer
- Washer
Outdoor Features
- In Ground Pool
- Covered Patio or Porch
Schools
- Eisenberg Elementary School
- Leavitt Justice Myron E Middle School
- Centennial High School
Utilities
- Central Heating and Cooling System
- Heating System Uses Gas
- Underground Utilities
- Cable TV Available
Community Details
- Association fees include management
- Mountain Shadow Association, Phone Number (702) 405-3300
- Dave Brown West Subdivision
Map
Home Values in the Area
Average Home Value in this Area
Tax History
| Year | Tax Paid | Tax Assessment Tax Assessment Total Assessment is a certain percentage of the fair market value that is determined by local assessors to be the total taxable value of land and additions on the property. | Land | Improvement |
|---|---|---|---|---|
| 2025 | $2,560 | $123,446 | $43,400 | $80,046 |
| 2024 | $2,486 | $123,446 | $43,400 | $80,046 |
| 2023 | $2,029 | $113,449 | $37,450 | $75,999 |
| 2022 | $2,414 | $106,624 | $36,750 | $69,874 |
| 2021 | $2,343 | $98,551 | $31,850 | $66,701 |
| 2020 | $2,225 | $98,986 | $32,550 | $66,436 |
| 2019 | $2,160 | $92,374 | $26,950 | $65,424 |
| 2018 | $2,142 | $85,997 | $22,400 | $63,597 |
| 2017 | $2,837 | $86,537 | $21,700 | $64,837 |
| 2016 | $2,029 | $77,814 | $18,200 | $59,614 |
| 2015 | $2,024 | $65,120 | $12,950 | $52,170 |
| 2014 | $1,965 | $58,159 | $10,500 | $47,659 |
Property History
| Date | Event | Price | List to Sale | Price per Sq Ft |
|---|---|---|---|---|
| 12/10/2025 12/10/25 | For Sale | $465,000 | 0.0% | $273 / Sq Ft |
| 12/08/2025 12/08/25 | Off Market | $465,000 | -- | -- |
Purchase History
| Date | Type | Sale Price | Title Company |
|---|---|---|---|
| Bargain Sale Deed | -- | -- | |
| Interfamily Deed Transfer | -- | None Available | |
| Interfamily Deed Transfer | -- | -- | |
| Deed | $145,000 | Old Republic Title Company | |
| Grant Deed | $140,000 | Land Title |
Mortgage History
| Date | Status | Loan Amount | Loan Type |
|---|---|---|---|
| Previous Owner | $50,050 | Assumption | |
| Previous Owner | $97,930 | No Value Available |
Source: Las Vegas REALTORS®
MLS Number: 2739798
APN: 138-04-810-032
Disclaimer: Certain information contained herein is derived from information provided by parties other than Homes.com. All information provided is deemed reliable, but is not guaranteed to be accurate and should be independently verified.
![]() The data relating to real estate for sale on this web site comes in part from the INTERNET DATA EXCHANGE Program of the Greater Las Vegas Association of REALTORS® MLS. Real estate listings held by brokerage firms other than this site owner are marked with the IDX logo. Information is deemed reliable but not guaranteed. Copyright 2025 of the Greater Las Vegas Association of REALTORS® MLS. All rights reserved.
The data relating to real estate for sale on this web site comes in part from the INTERNET DATA EXCHANGE Program of the Greater Las Vegas Association of REALTORS® MLS. Real estate listings held by brokerage firms other than this site owner are marked with the IDX logo. Information is deemed reliable but not guaranteed. Copyright 2025 of the Greater Las Vegas Association of REALTORS® MLS. All rights reserved.
- 7801 Safari Ln
- 7740 Wedlock Ln
- 7817 Safari Ln
- 7800 Four Seasons Dr
- 4128 Rimgate Dr
- 4228 Helena Cove Ct
- 4260 Helena Cove Ct
- 8017 Wedlock Ln
- 4013 Forest Knoll Ln
- 7737 Prosperity River Ave
- 4320 Conough Ln
- 4004 Featherstone Ln
- 7908 Constantinople Ave
- 4005 Coriander Ln
- 4050 N Tomsik St
- 3890 Quadrel St
- 7780 Hickam Ave
- 4450 Palisades Canyon Cir
- 3971 Coyote Ridge Ct
- 8075 Palm Cove Ct
- 3969 Jazzy Ginger Ct
- 3916 Varallo St
- 7937 Aviano Pines Ave
- 7764 Howard Dade Ave
- 10076 Roseum Ct
- 7834 W Gilmore Ave
- 7909 W Gilmore Ave
- 8109 Defiance Ave
- 7891 Macklin St
- 7907 Macklin St
- 7616 Rory Ct
- 7329 Halsey Ct
- 8132 Ahey Rd
- 4140 Brassy Boots Ct
- 4205 Lentil Ct
- 3608 Julia Waldene Ct
- 4112 N Dream Day St
- 4212 Haven Hurst Ct Unit 10
- 8456 W Gilmore Ave
- 3933 Country Lights St