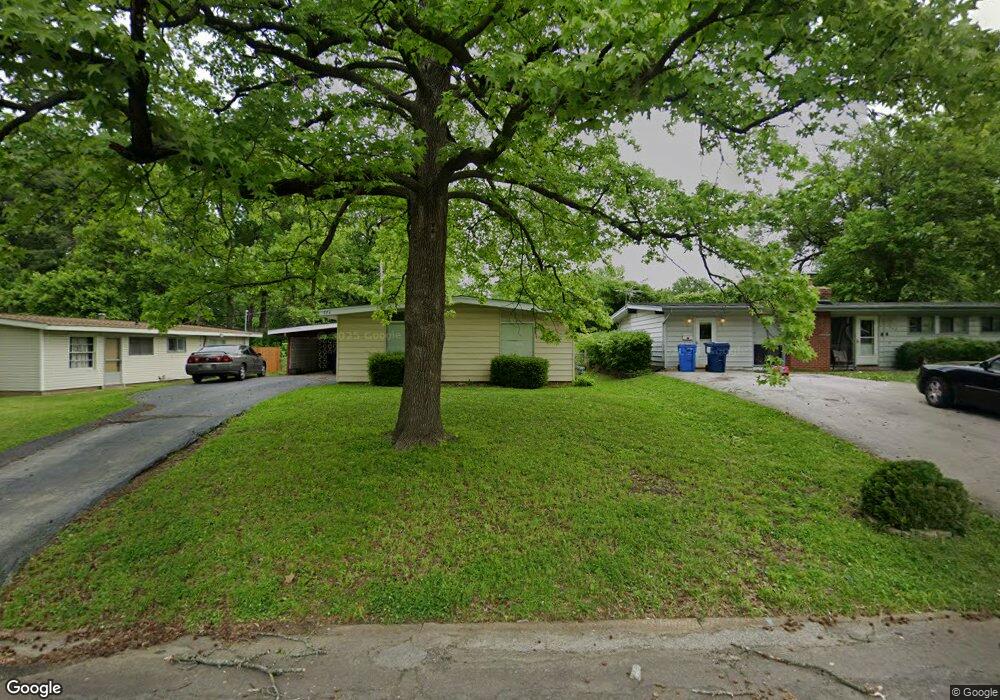
775 Bobbins Ln Florissant, MO 63033
Estimated Value: $130,000 - $155,000
3
Beds
1
Bath
1,148
Sq Ft
$124/Sq Ft
Est. Value
About This Home
This home is located at 775 Bobbins Ln, Florissant, MO 63033 and is currently estimated at $142,093, approximately $123 per square foot. 775 Bobbins Ln is a home located in St. Louis County with nearby schools including Robinwood Elementary School, Cross Keys Middle School, and McCluer North High School.
Ownership History
Date
Name
Owned For
Owner Type
Purchase Details
Closed on
Jan 2, 2014
Sold by
R & M Real Llc
Bought by
Ror Llc
Current Estimated Value
Purchase Details
Closed on
Nov 28, 2012
Sold by
Deutsche Bank National Trust Company
Bought by
R & M Real Llc
Purchase Details
Closed on
Aug 23, 2012
Sold by
Forbes David Brian and Forbes Jennifer Lynne
Bought by
Deutsche Bank National Trust Company
Purchase Details
Closed on
Apr 18, 2006
Sold by
Forbes Jennifer Lynne and Forbes David Brian
Bought by
Forbes David Brian and Forbes Jennifer Lynne
Home Financials for this Owner
Home Financials are based on the most recent Mortgage that was taken out on this home.
Original Mortgage
$81,000
Interest Rate
10.7%
Mortgage Type
Fannie Mae Freddie Mac
Purchase Details
Closed on
Sep 15, 1998
Sold by
Hauk Kenneth R and Hauk Shirley A
Bought by
Rike Jennifer L
Home Financials for this Owner
Home Financials are based on the most recent Mortgage that was taken out on this home.
Original Mortgage
$50,818
Interest Rate
6.93%
Mortgage Type
FHA
Create a Home Valuation Report for This Property
The Home Valuation Report is an in-depth analysis detailing your home's value as well as a comparison with similar homes in the area
Home Values in the Area
Average Home Value in this Area
Purchase History
| Date | Buyer | Sale Price | Title Company |
|---|---|---|---|
| Ror Llc | -- | None Available | |
| R & M Real Llc | $32,000 | None Available | |
| Deutsche Bank National Trust Company | $11,536 | None Available | |
| Forbes David Brian | -- | Residential Title Svcs Inc | |
| Rike Jennifer L | -- | -- |
Source: Public Records
Mortgage History
| Date | Status | Borrower | Loan Amount |
|---|---|---|---|
| Previous Owner | Forbes David Brian | $81,000 | |
| Previous Owner | Rike Jennifer L | $50,818 |
Source: Public Records
Tax History Compared to Growth
Tax History
| Year | Tax Paid | Tax Assessment Tax Assessment Total Assessment is a certain percentage of the fair market value that is determined by local assessors to be the total taxable value of land and additions on the property. | Land | Improvement |
|---|---|---|---|---|
| 2025 | $1,711 | $25,500 | $6,160 | $19,340 |
| 2024 | $1,711 | $21,930 | $4,640 | $17,290 |
| 2023 | $1,705 | $21,930 | $4,640 | $17,290 |
| 2022 | $1,423 | $16,020 | $4,640 | $11,380 |
| 2021 | $1,399 | $16,020 | $4,640 | $11,380 |
| 2020 | $1,218 | $13,150 | $3,550 | $9,600 |
| 2019 | $1,195 | $13,150 | $3,550 | $9,600 |
| 2018 | $1,024 | $10,030 | $2,050 | $7,980 |
| 2017 | $1,019 | $10,030 | $2,050 | $7,980 |
| 2016 | $983 | $9,420 | $2,050 | $7,370 |
| 2015 | $988 | $9,420 | $2,050 | $7,370 |
| 2014 | $1,172 | $11,590 | $3,440 | $8,150 |
Source: Public Records
Map
Nearby Homes
- 785 Bobbins Ln
- 2320 Allen Dr
- 750 Robinwood Dr
- 805 Derhake Rd
- 12 Country Ln
- 2240 Brook Dr
- 505 Ridge Dr
- 2340 Saint Catherine St
- 2505 Saint Catherine St
- 2020 Washington St Unit 707
- 105 Capri Dr
- 265 Waterford Dr
- 130 Dauphin Ln
- 675 Pimlico Dr
- 1965 Saint Catherine St
- 375 Waterford Dr
- 415 Waterford Dr
- 190 Coteau Ln
- 2 Carson Ct
- 2425 Johnstown Dr
- 765 Bobbins Ln
- 755 Bobbins Ln
- 770 Saint Anthony Ln
- 805 Bobbins Ln
- 760 Saint Anthony Ln
- 790 Saint Anthony Ln
- 750 Saint Anthony Ln
- 780 Bobbins Ln
- 770 Bobbins Ln
- 810 Saint Anthony Ln
- 815 Bobbins Ln
- 790 Bobbins Ln
- 760 Bobbins Ln
- 150 Taney Dr
- 170 Taney Dr
- 820 Saint Anthony Ln
- 800 Bobbins Ln
- 130 Taney Dr
- 180 Taney Dr
- 825 Bobbins Ln