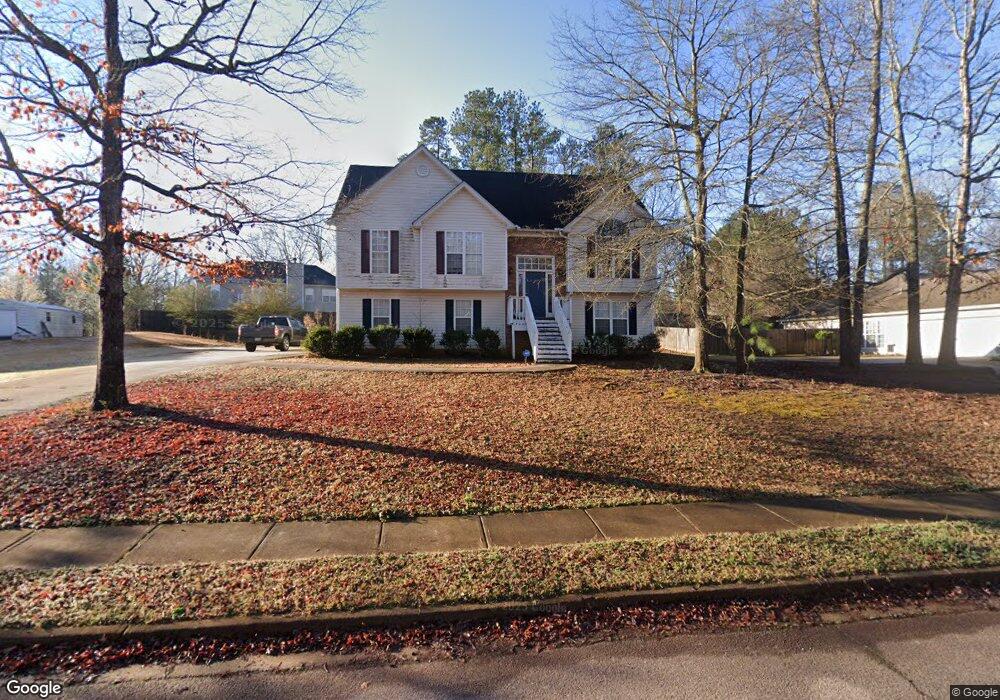
775 Chaseridge Dr Unit 112 McDonough, GA 30253
Estimated Value: $318,000 - $335,000
4
Beds
3
Baths
2,229
Sq Ft
$148/Sq Ft
Est. Value
About This Home
This home is located at 775 Chaseridge Dr Unit 112, McDonough, GA 30253 and is currently estimated at $330,723, approximately $148 per square foot. 775 Chaseridge Dr Unit 112 is a home located in Henry County with nearby schools including Flippen Elementary School, Eagle's Landing Middle School, and Eagle's Landing High School.
Ownership History
Date
Name
Owned For
Owner Type
Purchase Details
Closed on
May 16, 2014
Sold by
Wilburn Ronald S
Bought by
Wilburn Ronald S and Wilburn Deneshia Haggins
Current Estimated Value
Home Financials for this Owner
Home Financials are based on the most recent Mortgage that was taken out on this home.
Original Mortgage
$128,627
Outstanding Balance
$97,735
Interest Rate
4.25%
Mortgage Type
FHA
Estimated Equity
$232,988
Purchase Details
Closed on
Jan 7, 2004
Sold by
Holcombe Cheneeka
Bought by
Holcombe Cheneeka and Holcombe Orlandis
Home Financials for this Owner
Home Financials are based on the most recent Mortgage that was taken out on this home.
Original Mortgage
$155,000
Interest Rate
5%
Mortgage Type
New Conventional
Purchase Details
Closed on
Jul 11, 2003
Sold by
Bk Regions
Bought by
Sugar Creek Homes
Home Financials for this Owner
Home Financials are based on the most recent Mortgage that was taken out on this home.
Original Mortgage
$115,000
Interest Rate
5.2%
Mortgage Type
New Conventional
Create a Home Valuation Report for This Property
The Home Valuation Report is an in-depth analysis detailing your home's value as well as a comparison with similar homes in the area
Home Values in the Area
Average Home Value in this Area
Purchase History
| Date | Buyer | Sale Price | Title Company |
|---|---|---|---|
| Wilburn Ronald S | -- | -- | |
| Wilburn Ronald S | $131,000 | -- | |
| Holcombe Cheneeka | -- | -- | |
| Holcombe Cheneeka | -- | -- | |
| Holcombe Cheneeka | $155,000 | -- | |
| Sugar Creek Homes | $105,000 | -- |
Source: Public Records
Mortgage History
| Date | Status | Borrower | Loan Amount |
|---|---|---|---|
| Open | Holcombe Cheneeka | $128,627 | |
| Closed | Wilburn Ronald S | $128,627 | |
| Previous Owner | Holcombe Cheneeka | $155,000 | |
| Previous Owner | Sugar Creek Homes | $115,000 |
Source: Public Records
Tax History Compared to Growth
Tax History
| Year | Tax Paid | Tax Assessment Tax Assessment Total Assessment is a certain percentage of the fair market value that is determined by local assessors to be the total taxable value of land and additions on the property. | Land | Improvement |
|---|---|---|---|---|
| 2025 | $5,291 | $131,960 | $16,000 | $115,960 |
| 2024 | $5,291 | $126,560 | $16,000 | $110,560 |
| 2023 | $4,954 | $127,200 | $14,000 | $113,200 |
| 2022 | $3,852 | $98,480 | $14,000 | $84,480 |
| 2021 | $3,172 | $80,760 | $14,000 | $66,760 |
| 2020 | $2,781 | $70,560 | $12,000 | $58,560 |
| 2019 | $2,634 | $66,720 | $10,000 | $56,720 |
| 2018 | $2,497 | $63,160 | $10,000 | $53,160 |
| 2016 | $2,212 | $55,720 | $8,000 | $47,720 |
| 2015 | $2,117 | $51,640 | $8,000 | $43,640 |
| 2014 | $1,694 | $47,840 | $8,000 | $39,840 |
Source: Public Records
Map
Nearby Homes
- 245 Wynbrook Dr Unit 2
- 110 Woodcrest Way
- 659 Monticello Ln
- 250 Oakforest Dr
- 350 Dailey Mill Rd
- 340 Heavenly Hollow Place
- 332 Heavenly Hollow Place
- 337 Heavenly Hollow Place
- 336 Heavenly Hollow Place
- 349 Heavenly Hollow Place
- 220 Daileys Plantation Dr
- 615 Leafy Branch Way
- 619 Leafy Branch Way
- 660 Leafy Branch Way
- 775 Chaseridge Dr
- 715 Chaseridge Dr
- 785 Chaseridge Dr
- 725 Chaseridge Dr Unit III
- 705 Chaseridge Dr Unit 3
- 770 Chase Ridge Dr
- 770 Chaseridge Dr
- 770 Chaseridge Dr Unit 3
- 750 Chaseridge Dr
- 795 Chaseridge Dr
- 760 Chaseridge Dr Unit III
- 780 Chaseridge Dr Unit 3
- 790 Chaseridge Dr
- 740 Chaseridge Dr
- 695 Chaseridge Dr
- 845 Chaseridge Dr
- 730 Chaseridge Dr
- 855 Chaseridge Dr
- 720 Chaseridge Dr Unit 3
- 710 Chaseridge Dr Unit 3