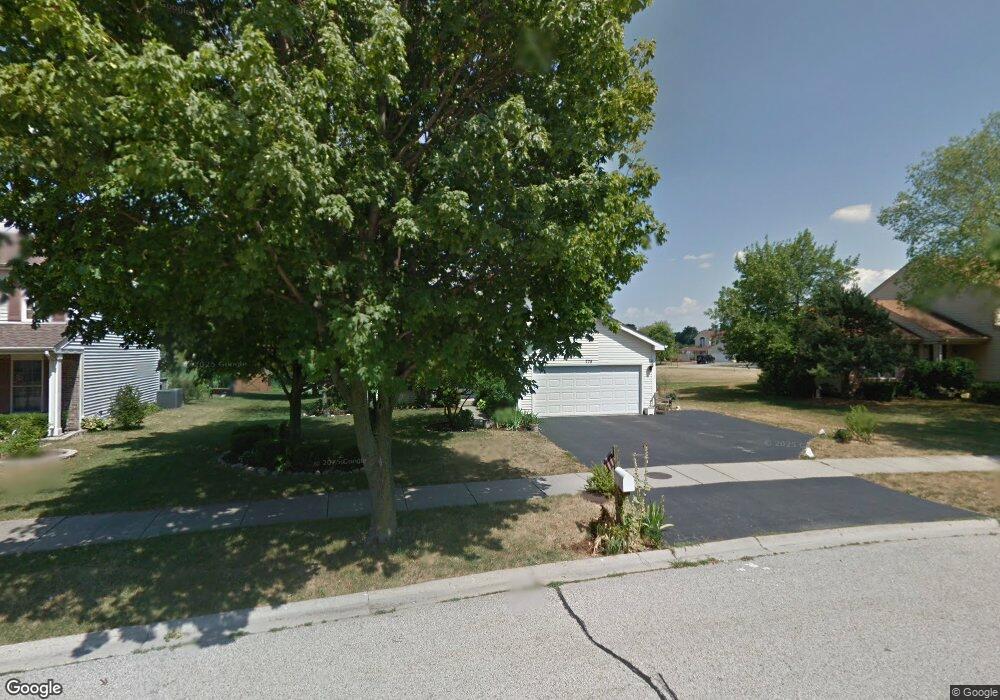
775 Cypress Bridge Rd Lake Zurich, IL 60047
Estimated Value: $515,945 - $554,000
4
Beds
3
Baths
2,247
Sq Ft
$239/Sq Ft
Est. Value
About This Home
This home is located at 775 Cypress Bridge Rd, Lake Zurich, IL 60047 and is currently estimated at $537,986, approximately $239 per square foot. 775 Cypress Bridge Rd is a home located in Lake County with nearby schools including Isaac Fox Elementary School, Lake Zurich Middle School - South Campus, and Lake Zurich High School.
Ownership History
Date
Name
Owned For
Owner Type
Purchase Details
Closed on
Jul 16, 2015
Sold by
Dote Marc A and Dote Francesca P
Bought by
Marc A Dote & Francesca P Dote Joint Tru
Current Estimated Value
Purchase Details
Closed on
Jun 21, 2006
Sold by
Blue Valerian L and Blue Cindy L
Bought by
Dote Marc and Dote Francesca Paterno
Home Financials for this Owner
Home Financials are based on the most recent Mortgage that was taken out on this home.
Original Mortgage
$340,000
Interest Rate
6.72%
Mortgage Type
Balloon
Purchase Details
Closed on
Sep 25, 2001
Sold by
Sikes Dale R and Sikes Nancy J
Bought by
Blue Valerian L and Blue Cindy L
Home Financials for this Owner
Home Financials are based on the most recent Mortgage that was taken out on this home.
Original Mortgage
$252,000
Interest Rate
6.92%
Purchase Details
Closed on
Mar 7, 1994
Sold by
Sikes Dale R and Sikes Nancy J
Bought by
Sikes Dale R and Sikes Nancy J
Create a Home Valuation Report for This Property
The Home Valuation Report is an in-depth analysis detailing your home's value as well as a comparison with similar homes in the area
Home Values in the Area
Average Home Value in this Area
Purchase History
| Date | Buyer | Sale Price | Title Company |
|---|---|---|---|
| Marc A Dote & Francesca P Dote Joint Tru | -- | None Available | |
| Dote Marc | $425,000 | None Available | |
| Blue Valerian L | $315,000 | -- | |
| Sikes Dale R | -- | -- |
Source: Public Records
Mortgage History
| Date | Status | Borrower | Loan Amount |
|---|---|---|---|
| Closed | Dote Marc | $340,000 | |
| Previous Owner | Blue Valerian L | $252,000 | |
| Closed | Blue Valerian L | $47,250 |
Source: Public Records
Tax History Compared to Growth
Tax History
| Year | Tax Paid | Tax Assessment Tax Assessment Total Assessment is a certain percentage of the fair market value that is determined by local assessors to be the total taxable value of land and additions on the property. | Land | Improvement |
|---|---|---|---|---|
| 2024 | $10,611 | $149,760 | $29,441 | $120,319 |
| 2023 | $9,520 | $142,879 | $28,088 | $114,791 |
| 2022 | $9,520 | $126,847 | $22,860 | $103,987 |
| 2021 | $9,190 | $123,596 | $22,274 | $101,322 |
| 2020 | $9,024 | $123,596 | $22,274 | $101,322 |
| 2019 | $9,091 | $125,197 | $22,080 | $103,117 |
| 2018 | $8,863 | $122,608 | $23,754 | $98,854 |
| 2017 | $8,803 | $121,131 | $23,468 | $97,663 |
| 2016 | $8,629 | $117,296 | $22,725 | $94,571 |
| 2015 | $8,504 | $111,721 | $21,645 | $90,076 |
| 2014 | $7,744 | $101,187 | $23,488 | $77,699 |
| 2012 | $7,681 | $101,400 | $23,537 | $77,863 |
Source: Public Records
Map
Nearby Homes
- 22145 W White Pine Rd
- 22228 W Casa Bella View
- 22218 W Casa Bella View
- 20688 N Oliver Ct
- 21186 W Preserve Dr
- 20678 N Oliver Ct
- 20992 W Preserve Dr
- 22207 W Casa Bella View
- 22106 W Casa Bella View
- 22164 W Casa Bella View
- 22110 W Casa Bella View
- 22144 W Casa Bella View
- 22112 W Casa Bella View
- 22118 W Casa Bella View
- 22075 W Casa Bella View
- 461 N Newberry Ct
- 22147 W Casa Bella View
- 22077 W Casa Bella View
- 22079 W Casa Bella View
- 22137 W Casa Bella View
- 765 Cypress Bridge Rd
- 785 Cypress Bridge Rd
- 755 Cypress Bridge Rd
- 87 E Harbor Dr
- 710 Shallow Cove Rd
- 745 Cypress Bridge Rd
- 84 E Harbor Dr
- 82 E Harbor Dr
- 80 E Harbor Dr
- 89 E Harbor Dr
- 78 E Harbor Dr
- 700 Shallow Cove Rd
- 735 Cypress Bridge Rd
- 88 E Harbor Dr Unit E
- 76 E Harbor Dr
- 740 Cypress Bridge Rd
- 91 E Harbor Dr
- 74 E Harbor Dr
- 72 E Harbor Dr
- 690 Shallow Cove Rd