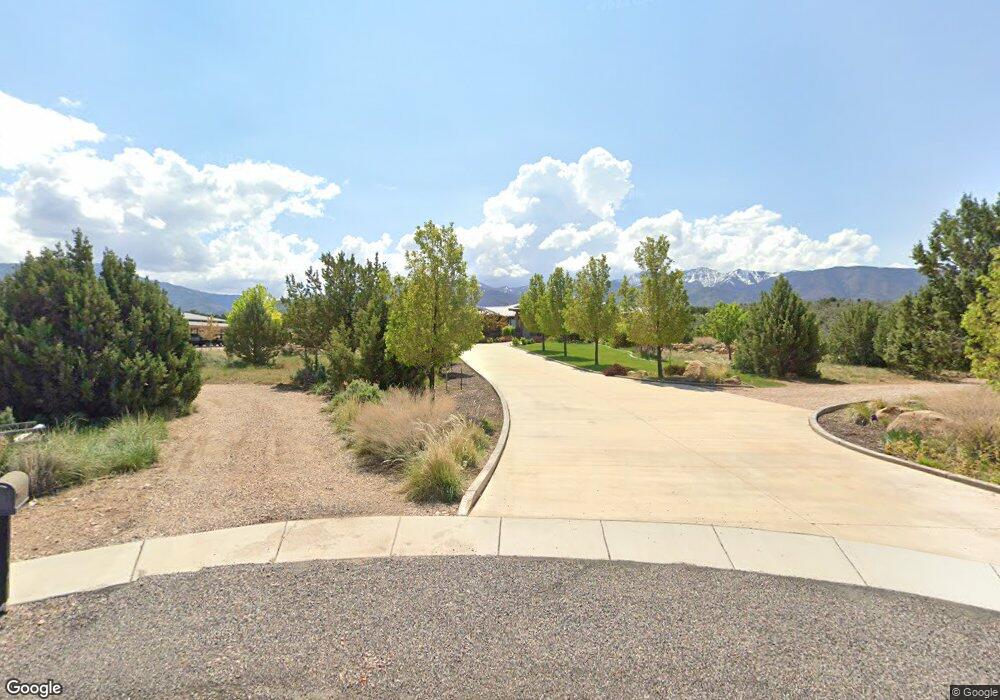
775 E Valley View Rd Fillmore, UT 84631
Estimated Value: $1,123,078 - $1,356,000
4
Beds
4
Baths
6,400
Sq Ft
$198/Sq Ft
Est. Value
About This Home
This home is located at 775 E Valley View Rd, Fillmore, UT 84631 and is currently estimated at $1,264,020, approximately $197 per square foot. 775 E Valley View Rd is a home located in Millard County.
Ownership History
Date
Name
Owned For
Owner Type
Purchase Details
Closed on
Feb 24, 2014
Sold by
Frederick J Frederick J and Dyer Donna Marie
Bought by
Blue Heron Llc
Current Estimated Value
Purchase Details
Closed on
Jun 9, 2011
Sold by
Marshall Thomas H and Marshall Eileen F
Bought by
Dryer Frederick J and Dryer Donna M
Purchase Details
Closed on
Dec 7, 2007
Sold by
Komarek James J and Komarek Lynette G
Bought by
Marshall Thomas H and Marshall Eileen F
Purchase Details
Closed on
Nov 23, 2005
Sold by
Twitchell Twitchell L and Twitchell Geniel H
Bought by
Brown Prson P and Brown Veralyn
Create a Home Valuation Report for This Property
The Home Valuation Report is an in-depth analysis detailing your home's value as well as a comparison with similar homes in the area
Home Values in the Area
Average Home Value in this Area
Purchase History
| Date | Buyer | Sale Price | Title Company |
|---|---|---|---|
| Blue Heron Llc | -- | -- | |
| Dryer Frederick J | -- | -- | |
| Marshall Thomas H | -- | -- | |
| Brown Prson P | -- | -- |
Source: Public Records
Tax History Compared to Growth
Tax History
| Year | Tax Paid | Tax Assessment Tax Assessment Total Assessment is a certain percentage of the fair market value that is determined by local assessors to be the total taxable value of land and additions on the property. | Land | Improvement |
|---|---|---|---|---|
| 2025 | $4,846 | $608,652 | $56,951 | $551,701 |
| 2024 | $4,846 | $577,385 | $78,177 | $499,208 |
| 2023 | $5,891 | $577,385 | $78,177 | $499,208 |
| 2022 | $4,782 | $429,408 | $55,817 | $373,591 |
| 2021 | $4,335 | $373,732 | $44,653 | $329,079 |
| 2020 | $3,544 | $307,332 | $40,594 | $266,738 |
| 2019 | $2,941 | $255,792 | $40,594 | $215,198 |
| 2018 | $2,873 | $255,792 | $40,594 | $215,198 |
| 2017 | $2,735 | $231,503 | $32,072 | $199,431 |
| 2016 | $2,616 | $231,503 | $32,072 | $199,431 |
| 2015 | $2,617 | $231,503 | $32,072 | $199,431 |
| 2014 | -- | $231,503 | $32,072 | $199,431 |
| 2013 | -- | $44,213 | $44,213 | $0 |
Source: Public Records
Map
Nearby Homes
- 690 E 500 S
- 750 800 South Fillmore
- 825 800 South Fillmore
- 800 800 South Fillmore
- 760 E 700 St S
- 405 E 500 St S
- 430 E Canyon Rd
- 157 E 500 South St
- 155 E 500 St S
- 235 S 200 St E
- 465 S 100 W
- 120 S 100 East Rd
- 40 S 100 Rd E
- 190 W 400 St S
- 155 W Center St
- 290 W 200 S
- 75 N 100 West St
- 165 N 100 W
- 310 S 500 West Rd
- 295 N 100 West St
