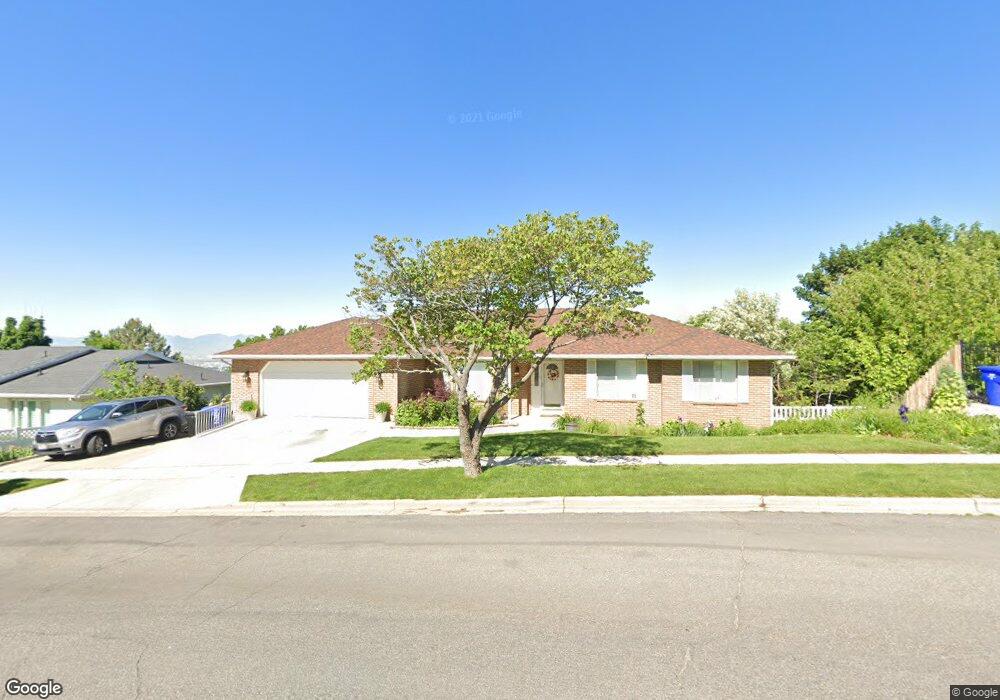
775 N 1300 E Bountiful, UT 84010
Estimated Value: $871,772 - $937,000
7
Beds
5
Baths
5,744
Sq Ft
$157/Sq Ft
Est. Value
About This Home
This home is located at 775 N 1300 E, Bountiful, UT 84010 and is currently estimated at $901,943, approximately $157 per square foot. 775 N 1300 E is a home located in Davis County with nearby schools including Holbrook Elementary School, Bountiful Junior High School, and Bountiful High School.
Ownership History
Date
Name
Owned For
Owner Type
Purchase Details
Closed on
Jan 8, 2021
Sold by
Rosser Benjamin
Bought by
Rosser Benjamin and Rosser Lorena
Current Estimated Value
Home Financials for this Owner
Home Financials are based on the most recent Mortgage that was taken out on this home.
Original Mortgage
$630,000
Outstanding Balance
$560,888
Interest Rate
2.7%
Mortgage Type
New Conventional
Estimated Equity
$341,055
Purchase Details
Closed on
Jan 7, 2021
Sold by
Murphy Darla and Legacy Trust
Bought by
Rosser Benjamin
Home Financials for this Owner
Home Financials are based on the most recent Mortgage that was taken out on this home.
Original Mortgage
$630,000
Outstanding Balance
$560,888
Interest Rate
2.7%
Mortgage Type
New Conventional
Estimated Equity
$341,055
Purchase Details
Closed on
May 12, 2017
Sold by
Murphy Darla
Bought by
Murphy Darla and Legacy Trust
Purchase Details
Closed on
Jun 11, 2016
Sold by
Murphy David W
Bought by
Murphy Darla A
Create a Home Valuation Report for This Property
The Home Valuation Report is an in-depth analysis detailing your home's value as well as a comparison with similar homes in the area
Purchase History
| Date | Buyer | Sale Price | Title Company |
|---|---|---|---|
| Rosser Benjamin | -- | Stewart Title Ins Agenc | |
| Rosser Benjamin | -- | Stewart Title Ins Age | |
| Murphy Darla | -- | -- | |
| Murphy Darla A | -- | -- |
Source: Public Records
Mortgage History
| Date | Status | Borrower | Loan Amount |
|---|---|---|---|
| Open | Rosser Benjamin | $630,000 |
Source: Public Records
Tax History
| Year | Tax Paid | Tax Assessment Tax Assessment Total Assessment is a certain percentage of the fair market value that is determined by local assessors to be the total taxable value of land and additions on the property. | Land | Improvement |
|---|---|---|---|---|
| 2025 | $5,295 | $459,250 | $153,294 | $305,956 |
| 2024 | $4,716 | $439,450 | $141,242 | $298,208 |
| 2023 | $4,820 | $842,000 | $257,340 | $584,660 |
| 2022 | $5,066 | $480,700 | $137,205 | $343,495 |
| 2021 | $4,510 | $662,000 | $204,032 | $457,968 |
| 2020 | $3,518 | $516,000 | $168,868 | $347,132 |
| 2019 | $3,565 | $511,000 | $163,841 | $347,159 |
| 2018 | $3,390 | $479,000 | $152,537 | $326,463 |
| 2016 | $3,112 | $238,920 | $74,182 | $164,738 |
| 2015 | $3,050 | $221,155 | $74,182 | $146,973 |
| 2014 | $2,713 | $200,998 | $74,182 | $126,816 |
| 2013 | -- | $208,597 | $70,356 | $138,241 |
Source: Public Records
Map
Nearby Homes
- 1342 Northridge Dr
- 933 Northern Hills Cir
- 1342 E Skyline Dr N Unit 30
- 908 Northern Hills Dr Unit 3
- 1105 E 600 N
- 1023 E 800 N
- 111 Eagle Ridge Dr
- 975 E 1050 N
- 662 E 1200 N
- 1138 Briggs Dr
- 683 E 100 N
- 610 E Pages Ln
- 345 N 400 E
- 453 N 400 E Unit 7-D
- 610 S 800 E
- 0 Lot Bountiful Blvd
- 495 E 475 S
- 345 E 600 S
- 1420 N Main St
- 520 S Orchard Dr Unit 17
- 755 N 1300 E
- 740 Northridge Dr
- 778 N 1300 E
- 778 Skyline Dr
- 735 Skyline Dr
- 758 N Skyline Dr E
- 735 N 1300 E
- 758 N 1300 E
- 690 Northridge Dr
- 1305 Skyline Dr
- 738 Skyline Dr
- 1326 Skyline Dr
- 738 N Skyline Dr E
- 1326 Skyline Dr
- 738 N 1300 E
- 1336 Skyline Dr
- 1311 Skyline Dr
- 784 Northridge Dr
- 715 N 1300 E
- 1311 Skyline Dr
Your Personal Tour Guide
Ask me questions while you tour the home.