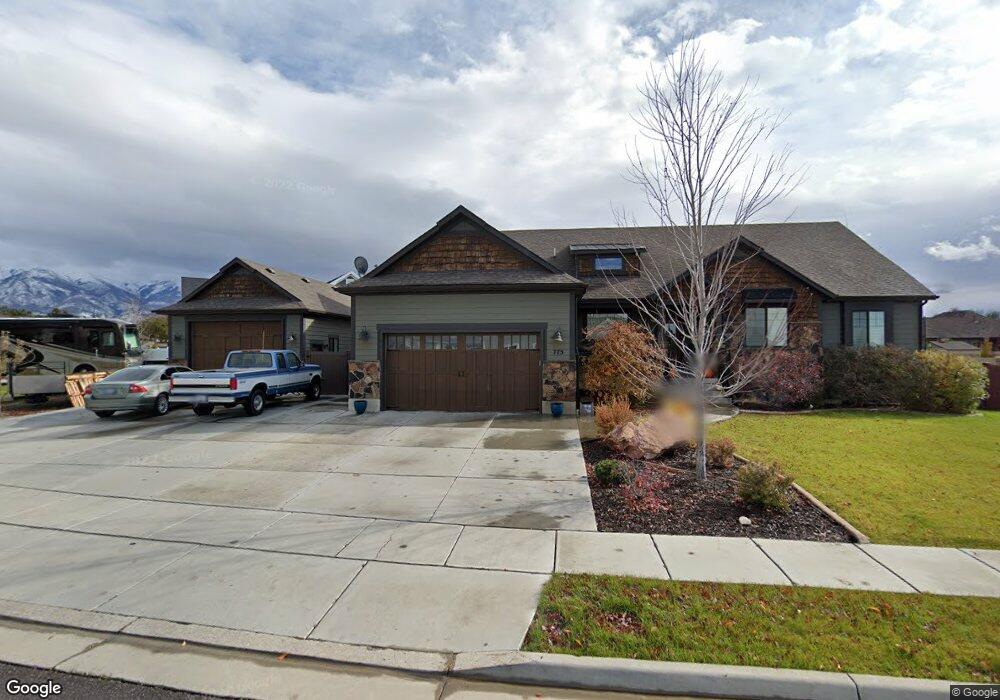
775 S Arbor Way Layton, UT 84041
Estimated Value: $822,000 - $987,619
6
Beds
4
Baths
4,474
Sq Ft
$208/Sq Ft
Est. Value
About This Home
This home is located at 775 S Arbor Way, Layton, UT 84041 and is currently estimated at $928,405, approximately $207 per square foot. 775 S Arbor Way is a home located in Davis County with nearby schools including Heritage Elementary School, Shoreline Junior High School, and Layton High School.
Ownership History
Date
Name
Owned For
Owner Type
Purchase Details
Closed on
Aug 5, 2019
Sold by
Yocom Matthew R and Yocom Meghan R
Bought by
Seifert Janet and Seifert Shawn
Current Estimated Value
Home Financials for this Owner
Home Financials are based on the most recent Mortgage that was taken out on this home.
Original Mortgage
$548,000
Outstanding Balance
$479,899
Interest Rate
3.8%
Mortgage Type
New Conventional
Estimated Equity
$448,506
Purchase Details
Closed on
Aug 4, 2017
Sold by
Higley Taft and Higley Jillaire
Bought by
Yocom Matthew R and Yocom Meghan R
Home Financials for this Owner
Home Financials are based on the most recent Mortgage that was taken out on this home.
Original Mortgage
$217,000
Interest Rate
3.9%
Mortgage Type
New Conventional
Purchase Details
Closed on
May 6, 2016
Sold by
Tbb Investments Ltd
Bought by
Higley Taft and Higley Jillaire
Create a Home Valuation Report for This Property
The Home Valuation Report is an in-depth analysis detailing your home's value as well as a comparison with similar homes in the area
Home Values in the Area
Average Home Value in this Area
Purchase History
| Date | Buyer | Sale Price | Title Company |
|---|---|---|---|
| Seifert Janet | -- | Inwest Title Services | |
| Yocom Matthew R | -- | First American Title | |
| Higley Taft | -- | First American Title |
Source: Public Records
Mortgage History
| Date | Status | Borrower | Loan Amount |
|---|---|---|---|
| Open | Seifert Janet | $548,000 | |
| Previous Owner | Yocom Matthew R | $217,000 |
Source: Public Records
Tax History Compared to Growth
Tax History
| Year | Tax Paid | Tax Assessment Tax Assessment Total Assessment is a certain percentage of the fair market value that is determined by local assessors to be the total taxable value of land and additions on the property. | Land | Improvement |
|---|---|---|---|---|
| 2025 | $4,721 | $495,550 | $151,963 | $343,587 |
| 2024 | $4,489 | $474,650 | $156,936 | $317,714 |
| 2023 | $4,383 | $817,000 | $178,445 | $638,555 |
| 2022 | $4,619 | $467,500 | $96,059 | $371,441 |
| 2021 | $4,326 | $653,000 | $144,008 | $508,992 |
| 2020 | $4,185 | $606,000 | $125,162 | $480,838 |
| 2019 | $3,991 | $566,000 | $118,573 | $447,427 |
| 2018 | $3,785 | $539,000 | $105,056 | $433,944 |
| 2016 | $2,239 | $164,462 | $46,424 | $118,038 |
| 2015 | $1,241 | $84,407 | $84,407 | $0 |
| 2014 | $1,184 | $84,407 | $84,407 | $0 |
Source: Public Records
Map
Nearby Homes
- 557 S Angel St
- 1042 W Shoreline Dr
- 796 S Rock Creek Corner
- Creighton Farmhouse Plan at Angel Hill
- 1038 S Old Towne Rd
- 562 S 850 W
- 774 W Farming Way
- 1015 W 350 S
- 362 S 950 W
- 296 S 950 W
- 2056 W Phillips St
- 920 S 1700 W Unit 1
- 583 S Alberta Spruce Dr
- 1124 S Neville St
- 1278 S Grace Way
- 1234 S Grace Way
- 1494 S Mica Ln
- 933 W Gentile St
- 1910 W Bonneville Ln
- 2182 W Evergreen Way Unit 143
- 771 S Arbor Way
- 1530 Layton Pkwy
- 768 S Arbor Way
- 767 S Arbor Way
- 1320 W Forest Creek Ln
- 1265 W 725 S
- 1302 W Forest Creek Ln
- 1283 W 725 S
- 1301 W 725 S
- 1247 W 725 S
- 1282 W Forest Creek Ln
- 798 S Angel St
- 1354 W Forest Creek Ln
- 763 S Arbor Way
- 814 S Angel St
- 1317 W 725 S
- 1233 W 725 S
- 1274 W Forest Creek Ln
- 1364 W Forest Creek Ln
- 1335 W 725 S