775 Turner Rd Columbus, GA 31904
Northern Columbus NeighborhoodEstimated Value: $138,000 - $212,000
3
Beds
2
Baths
1,343
Sq Ft
$124/Sq Ft
Est. Value
About This Home
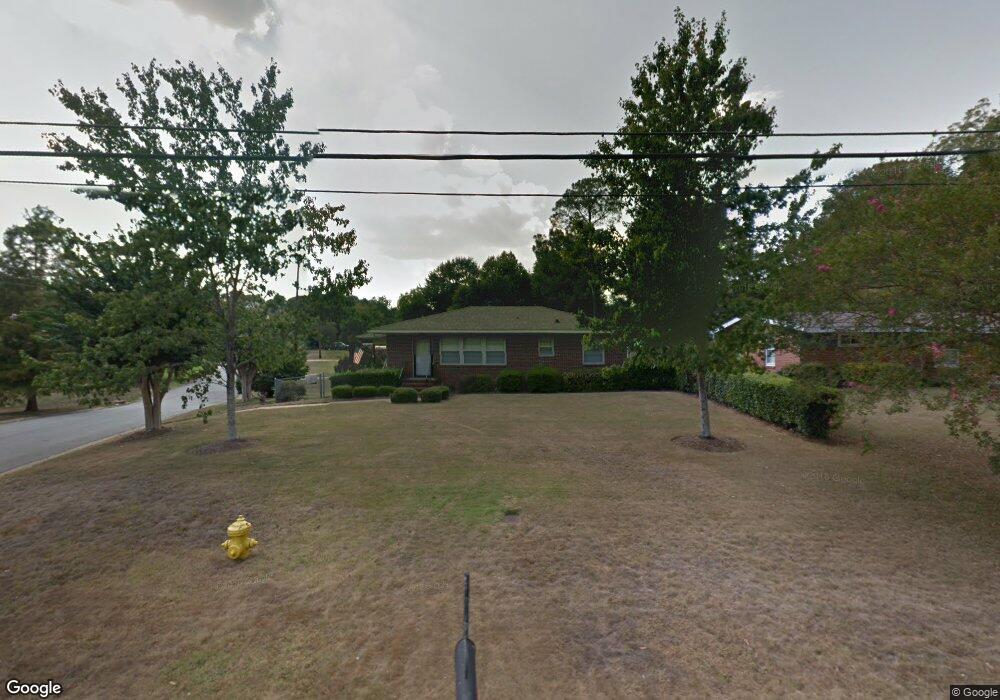
This home is located at 775 Turner Rd, Columbus, GA 31904 and is currently estimated at $167,162, approximately $124 per square foot. 775 Turner Rd is a home located in Muscogee County with nearby schools including River Road Elementary School, Arnold Middle School, and Jordan Vocational High School.
Ownership History
Date
Name
Owned For
Owner Type
Purchase Details
Closed on
Oct 21, 2019
Sold by
G & M Kennon Properties Lllp
Bought by
Edwards Starla and Edwards Joshua P
Current Estimated Value
Home Financials for this Owner
Home Financials are based on the most recent Mortgage that was taken out on this home.
Original Mortgage
$127,546
Outstanding Balance
$113,704
Interest Rate
4.4%
Mortgage Type
FHA
Estimated Equity
$53,458
Purchase Details
Closed on
Feb 5, 2019
Sold by
Tutherow David K
Bought by
G & M Kennon Properties Lllp
Purchase Details
Closed on
Apr 29, 2015
Sold by
Mcguffey Evelyn
Bought by
Tutherow David K
Home Financials for this Owner
Home Financials are based on the most recent Mortgage that was taken out on this home.
Original Mortgage
$96,224
Interest Rate
4.5%
Mortgage Type
FHA
Purchase Details
Closed on
May 9, 2013
Sold by
Martin Grace Pelham
Bought by
Mcguffey Evelyn
Create a Home Valuation Report for This Property
The Home Valuation Report is an in-depth analysis detailing your home's value as well as a comparison with similar homes in the area
Home Values in the Area
Average Home Value in this Area
Purchase History
| Date | Buyer | Sale Price | Title Company |
|---|---|---|---|
| Edwards Starla | $129,900 | -- | |
| G & M Kennon Properties Lllp | $31,000 | -- | |
| Tutherow David K | $98,000 | -- | |
| Mcguffey Evelyn | $97,000 | -- |
Source: Public Records
Mortgage History
| Date | Status | Borrower | Loan Amount |
|---|---|---|---|
| Open | Edwards Starla | $127,546 | |
| Previous Owner | Tutherow David K | $96,224 |
Source: Public Records
Tax History Compared to Growth
Tax History
| Year | Tax Paid | Tax Assessment Tax Assessment Total Assessment is a certain percentage of the fair market value that is determined by local assessors to be the total taxable value of land and additions on the property. | Land | Improvement |
|---|---|---|---|---|
| 2025 | $858 | $45,836 | $9,336 | $36,500 |
| 2024 | $857 | $45,836 | $9,336 | $36,500 |
| 2023 | $168 | $45,836 | $9,336 | $36,500 |
| 2022 | $893 | $35,060 | $7,004 | $28,056 |
| 2021 | $887 | $35,108 | $7,004 | $28,104 |
| 2020 | $887 | $35,108 | $7,004 | $28,104 |
| 2019 | $1,059 | $35,108 | $7,004 | $28,104 |
| 2018 | $1,059 | $35,108 | $7,004 | $28,104 |
| 2017 | $1,064 | $35,108 | $7,004 | $28,104 |
| 2016 | $1,070 | $39,199 | $2,326 | $36,873 |
| 2015 | $1,602 | $38,799 | $2,326 | $36,473 |
| 2014 | -- | $38,799 | $2,326 | $36,473 |
| 2013 | -- | $25,478 | $2,326 | $23,152 |
Source: Public Records
Map
Nearby Homes