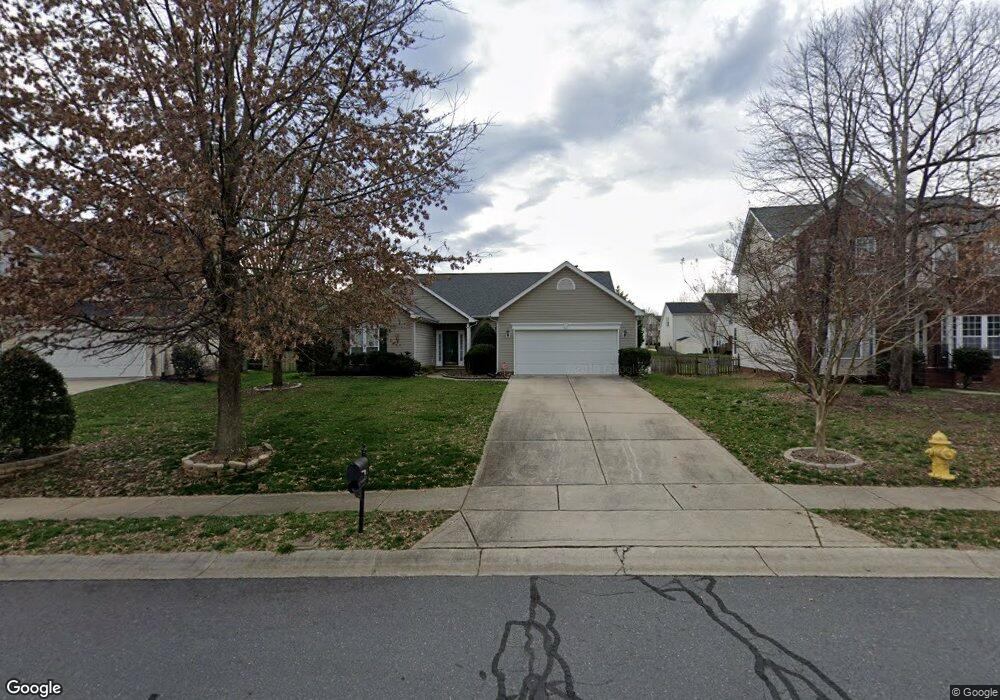
7752 Cotswold Ct Charlotte, NC 28213
Back Creek Church Road NeighborhoodEstimated Value: $389,549 - $409,000
3
Beds
2
Baths
1,903
Sq Ft
$209/Sq Ft
Est. Value
About This Home
This home is located at 7752 Cotswold Ct, Charlotte, NC 28213 and is currently estimated at $398,387, approximately $209 per square foot. 7752 Cotswold Ct is a home located in Mecklenburg County with nearby schools including Harrisburg Elementary School, Hickory Ridge Middle, and Hickory Ridge High School.
Ownership History
Date
Name
Owned For
Owner Type
Purchase Details
Closed on
Aug 31, 2007
Sold by
Garbark Nathaniel M and Garbark Katie S
Bought by
Stone Wayne
Current Estimated Value
Home Financials for this Owner
Home Financials are based on the most recent Mortgage that was taken out on this home.
Original Mortgage
$100,000
Outstanding Balance
$63,734
Interest Rate
6.7%
Mortgage Type
New Conventional
Estimated Equity
$334,653
Purchase Details
Closed on
Jun 29, 2001
Sold by
Westminster Homes Charlotte Inc
Bought by
Garbark Nathaniel M and Barbark Katie S
Home Financials for this Owner
Home Financials are based on the most recent Mortgage that was taken out on this home.
Original Mortgage
$154,850
Interest Rate
7.14%
Purchase Details
Closed on
Feb 23, 2001
Sold by
Crossland Coventry Llc
Bought by
Westminster Homes Charlotte Inc
Create a Home Valuation Report for This Property
The Home Valuation Report is an in-depth analysis detailing your home's value as well as a comparison with similar homes in the area
Home Values in the Area
Average Home Value in this Area
Purchase History
| Date | Buyer | Sale Price | Title Company |
|---|---|---|---|
| Stone Wayne | $197,000 | Colonial Title Company | |
| Garbark Nathaniel M | $163,000 | -- | |
| Westminster Homes Charlotte Inc | $31,500 | -- |
Source: Public Records
Mortgage History
| Date | Status | Borrower | Loan Amount |
|---|---|---|---|
| Open | Stone Wayne | $100,000 | |
| Previous Owner | Garbark Nathaniel M | $154,850 |
Source: Public Records
Tax History Compared to Growth
Tax History
| Year | Tax Paid | Tax Assessment Tax Assessment Total Assessment is a certain percentage of the fair market value that is determined by local assessors to be the total taxable value of land and additions on the property. | Land | Improvement |
|---|---|---|---|---|
| 2025 | $3,414 | $346,210 | $100,000 | $246,210 |
| 2024 | $3,414 | $346,210 | $100,000 | $246,210 |
| 2023 | $2,561 | $217,980 | $60,000 | $157,980 |
| 2022 | $2,561 | $217,690 | $60,000 | $157,690 |
| 2021 | $2,384 | $217,690 | $60,000 | $157,690 |
| 2020 | $2,384 | $217,690 | $60,000 | $157,690 |
| 2019 | $1,780 | $162,540 | $32,000 | $130,540 |
| 2018 | $1,747 | $162,540 | $32,000 | $130,540 |
| 2017 | $1,609 | $162,540 | $32,000 | $130,540 |
| 2016 | $1,609 | $150,670 | $28,000 | $122,670 |
| 2015 | $1,047 | $150,670 | $28,000 | $122,670 |
| 2014 | $1,047 | $150,670 | $28,000 | $122,670 |
Source: Public Records
Map
Nearby Homes
- 6010 Albiza Dr
- 13834 Riding Hill Ave Unit 137
- 8015 Frances Haven Dr
- 5116 Sunburst Ln
- 3414 Broadwick St
- 3220 Barons Court Rd
- 13703 Rutherglen Ct
- 4514 Dalbeth St
- 4208 Coulter Crossing
- 4214 Coulter Crossing
- 4235 Coulter Crossing
- 440 Nathaniel Dale Place Unit BRX0041
- 437 Nathaniel Dale Place Unit BRX0034
- 429 Nathaniel Dale Place Unit BRX0032
- 408 Nathaniel Dale Place Unit BRX0053
- 412 Nathaniel Dale Place Unit BRX0052
- 8915 Merrie Rose Ave
- 13812 Connell Green Dr
- 10305 Flat Stone Rd
- 13409 Glasgow Green Ln
- 7744 Cotswold Ct
- 7760 Cotswold Ct
- 6228 Underwood Ave
- 6224 Underwood Ave
- 7768 Cotswold Ct
- 7738 Cotswold Ct
- 6232 Underwood Ave
- 6220 Underwood Ave
- 6216 Underwood Ave
- 6236 Underwood Ave
- 7751 Cotswold Ct
- 7774 Cotswold Ct
- 7730 Cotswold Ct
- 6212 Underwood Ave
- 7741 Cotswold Ct
- 7741 Cotswold Ct Unit 38
- 7771 Cotswold Ct
- 4002 Evelyn Ave
- 6244 Underwood Ave
- 6240 Underwood Ave