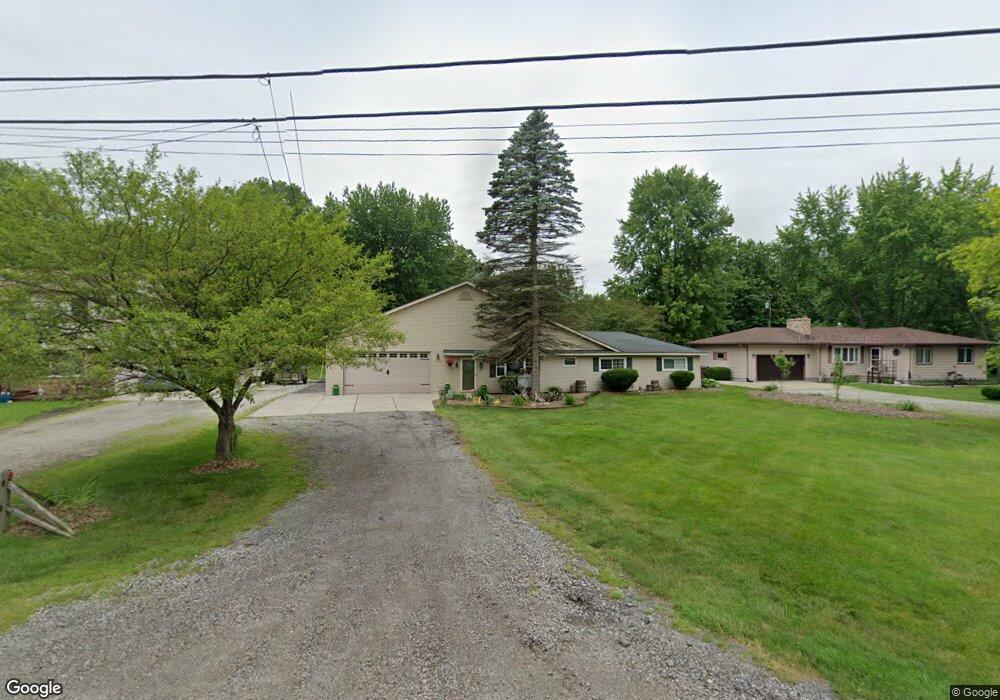
7753 Exeter Rd Monroe, MI 48162
Estimated Value: $321,923 - $417,000
3
Beds
2
Baths
1,989
Sq Ft
$185/Sq Ft
Est. Value
About This Home
This home is located at 7753 Exeter Rd, Monroe, MI 48162 and is currently estimated at $368,731, approximately $185 per square foot. 7753 Exeter Rd is a home located in Monroe County with nearby schools including Monroe High School, Holy Ghost Lutheran School, and St. Patrick Elementary School.
Ownership History
Date
Name
Owned For
Owner Type
Purchase Details
Closed on
Jun 7, 2019
Sold by
Majtyka Shawn P
Bought by
Majtyka Shawn
Current Estimated Value
Purchase Details
Closed on
Feb 21, 2010
Sold by
Majtyka Shawn P and Cooper Felicia L
Bought by
Majtyka Shawn P and Cooper Felicia L
Purchase Details
Closed on
Dec 21, 2009
Sold by
Citimortgage Inc
Bought by
Cooper Felicia and Majtyka Shawn
Purchase Details
Closed on
Sep 14, 1995
Sold by
Durham Jerry L
Bought by
Mccaffrey Pete B and Mccaffrey Michelle L
Home Financials for this Owner
Home Financials are based on the most recent Mortgage that was taken out on this home.
Original Mortgage
$82,350
Interest Rate
7.81%
Mortgage Type
New Conventional
Create a Home Valuation Report for This Property
The Home Valuation Report is an in-depth analysis detailing your home's value as well as a comparison with similar homes in the area
Home Values in the Area
Average Home Value in this Area
Purchase History
| Date | Buyer | Sale Price | Title Company |
|---|---|---|---|
| Majtyka Shawn | -- | None Listed On Document | |
| Majtyka Shawn P | -- | -- | |
| Cooper Felicia | $75,900 | -- | |
| Mccaffrey Pete B | $91,500 | -- |
Source: Public Records
Mortgage History
| Date | Status | Borrower | Loan Amount |
|---|---|---|---|
| Previous Owner | Mccaffrey Pete B | $82,350 |
Source: Public Records
Tax History
| Year | Tax Paid | Tax Assessment Tax Assessment Total Assessment is a certain percentage of the fair market value that is determined by local assessors to be the total taxable value of land and additions on the property. | Land | Improvement |
|---|---|---|---|---|
| 2025 | $1,057 | $155,700 | $155,700 | $0 |
| 2024 | $1,025 | $148,700 | $0 | $0 |
| 2023 | $977 | $120,500 | $0 | $0 |
| 2022 | $2,073 | $120,500 | $0 | $0 |
| 2021 | $2,005 | $111,500 | $0 | $0 |
| 2020 | $1,964 | $103,400 | $0 | $0 |
| 2019 | $1,823 | $103,400 | $0 | $0 |
| 2018 | $2,045 | $91,900 | $0 | $0 |
| 2017 | $2,139 | $91,900 | $0 | $0 |
| 2016 | $2,141 | $86,000 | $0 | $0 |
| 2015 | $2,083 | $76,033 | $0 | $0 |
| 2014 | $2,226 | $76,033 | $0 | $0 |
| 2013 | -- | $73,302 | $0 | $0 |
Source: Public Records
Map
Nearby Homes
- 3290 Gruber Rd
- 3186 Bluebush Rd
- 4011 Bluebush Rd
- 8485 S Stoney Creek Rd
- 2525 Reinhardt Rd
- 9601 Exeter Rd
- 1969 Lasalle Rd
- 8705 Steffas Rd
- 2250 Gunnison Ln
- 2025 Carson Ln
- 2535 N Telegraph Rd
- 0 N Telegraph Rd
- 0 N Telegraph Rd Unit 50165571
- 0 N Telegraph Rd Unit 25053939
- 2406 N Telegraph Rd
- 420 Grassey Ln
- 5571 Zink Rd
- 1811 N Telegraph Rd Unit Lot 42
- 5942 Bluebush Rd
- 2200 Sheick Rd
- 7811 Exeter Rd
- 7821 Exeter Rd
- 7717 Exeter Rd
- 7741 Exeter Rd
- 7739 Exeter Rd
- 7697 Exeter Rd
- 0 Exeter Rd Unit 212084648
- 0 N Exeter Rd Unit 20424666
- 0 Exeter Rd Unit 4168638
- 0 N Exeter Rd Unit 4673826
- 0 Exeter Rd Unit 4923713
- 0 Exeter Rd Unit 4469899
- 0 Exeter Rd Unit 901747
- 0 Exeter Rd Unit 20099052
- 7844 Exeter Rd
- 7667 Exeter Rd
- 7710 Exeter Rd
- 7710 Exeter 47100
- 7833 Exeter Rd
- 7700 Exeter Rd
Your Personal Tour Guide
Ask me questions while you tour the home.