Estimated Value: $558,000 - $626,000
3
Beds
4
Baths
2,540
Sq Ft
$235/Sq Ft
Est. Value
About This Home
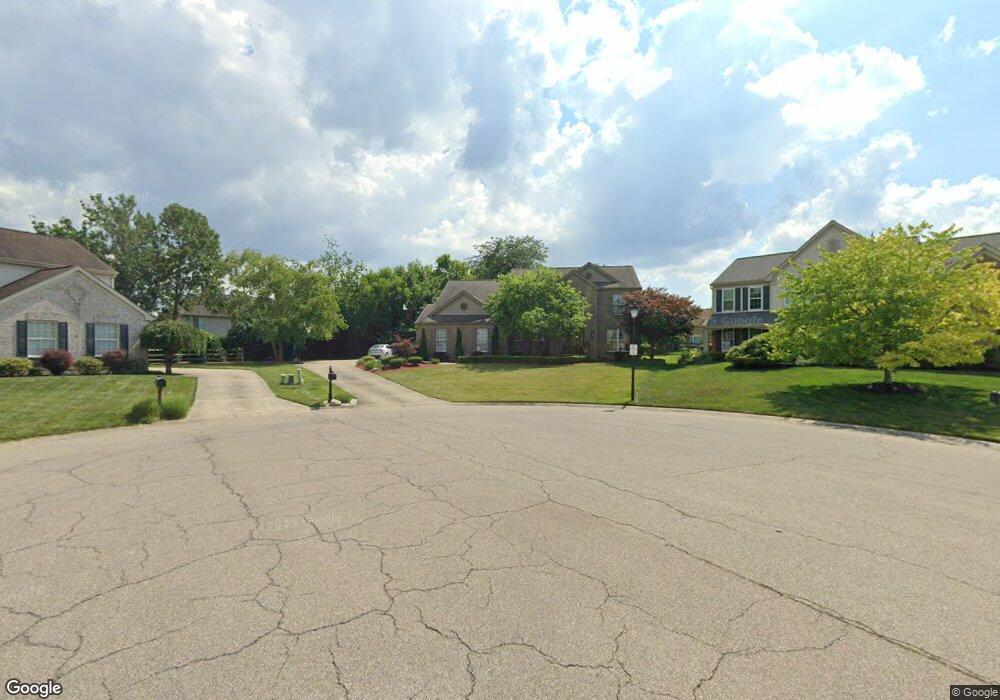
This home is located at 7757 E Bay Dr, Mason, OH 45040 and is currently estimated at $596,985, approximately $235 per square foot. 7757 E Bay Dr is a home located in Warren County with nearby schools including Mason Intermediate Elementary School, Mason Middle School, and William Mason High School.
Ownership History
Date
Name
Owned For
Owner Type
Purchase Details
Closed on
Jun 19, 2003
Sold by
Howicz Mary A and Howicz David S
Bought by
Nguyen John
Current Estimated Value
Home Financials for this Owner
Home Financials are based on the most recent Mortgage that was taken out on this home.
Original Mortgage
$225,000
Interest Rate
5.4%
Mortgage Type
Purchase Money Mortgage
Purchase Details
Closed on
Nov 19, 1998
Sold by
Fischer Family Homes Ltd
Bought by
Howicz David S and Howicz Mary A
Home Financials for this Owner
Home Financials are based on the most recent Mortgage that was taken out on this home.
Original Mortgage
$216,000
Interest Rate
6.59%
Mortgage Type
New Conventional
Purchase Details
Closed on
Aug 14, 1998
Sold by
Al & Char Ltd Ptns
Bought by
Fischer Single Family Homes Ltd
Create a Home Valuation Report for This Property
The Home Valuation Report is an in-depth analysis detailing your home's value as well as a comparison with similar homes in the area
Home Values in the Area
Average Home Value in this Area
Purchase History
| Date | Buyer | Sale Price | Title Company |
|---|---|---|---|
| Nguyen John | $322,500 | Advanced Land Title Agency L | |
| Howicz David S | $268,883 | -- | |
| Fischer Single Family Homes Ltd | $140,787 | -- |
Source: Public Records
Mortgage History
| Date | Status | Borrower | Loan Amount |
|---|---|---|---|
| Closed | Nguyen John | $225,000 | |
| Previous Owner | Howicz David S | $216,000 |
Source: Public Records
Tax History
| Year | Tax Paid | Tax Assessment Tax Assessment Total Assessment is a certain percentage of the fair market value that is determined by local assessors to be the total taxable value of land and additions on the property. | Land | Improvement |
|---|---|---|---|---|
| 2024 | $7,200 | $164,410 | $38,500 | $125,910 |
| 2023 | $6,506 | $127,543 | $20,650 | $106,893 |
| 2022 | $6,506 | $127,544 | $20,650 | $106,894 |
| 2021 | $6,189 | $127,544 | $20,650 | $106,894 |
| 2020 | $6,176 | $108,087 | $17,500 | $90,587 |
| 2019 | $5,723 | $108,087 | $17,500 | $90,587 |
| 2018 | $5,708 | $108,087 | $17,500 | $90,587 |
| 2017 | $5,321 | $92,292 | $15,813 | $76,479 |
| 2016 | $5,470 | $92,292 | $15,813 | $76,479 |
| 2015 | $5,082 | $92,292 | $15,813 | $76,479 |
| 2014 | $5,082 | $79,560 | $13,630 | $65,930 |
| 2013 | $5,093 | $102,130 | $17,500 | $84,630 |
Source: Public Records
Map
Nearby Homes
- 4251 S Shore Dr
- 4344 North Point
- 2107 Clearwater Ct
- 2115 Clearwater Ct
- 4379 English Oak Ct Unit 38302
- 4431 English Oak Ct
- 4467 English Oak Ct
- 4465 Black Oak Ln
- 7162 Scarlet Oak Ct
- 7353 Prairie View Ct
- 4618 Kamm Ln
- 3432 Hidden Falls Ct
- 7153 Traditions Turn
- 7114 Traditions Turn
- 7174 Traditions Turn
- 7144 Traditions Turn
- 7154 Traditions Turn
- 7103 Traditions Turn
- 7411 Victoria Falls Ave
- 7173 Traditions Turn
- 7749 E Bay Dr
- 4176 Caribou Ct
- 7756 E Bay Dr
- 4175 Caribou Ct
- 7678 Cove View Dr
- 7696 Cove View Dr
- 4172 Caribou Ct
- 7662 Cove View Dr
- 7735 E Bay Dr
- 7750 E Bay Dr
- 7710 Cove View Dr
- 7738 E Bay Dr
- 7648 Cove View Dr
- 4171 Caribou Ct
- 4156 Caribou Ct
- 7719 E Bay Dr
- 7724 Cove View Dr
- 7703 Deer Crossing Dr
- 7722 E Bay Dr
- 7715 Deer Crossing Dr