Estimated Value: $1,399,000 - $1,730,000
6
Beds
5
Baths
4,012
Sq Ft
$399/Sq Ft
Est. Value
About This Home
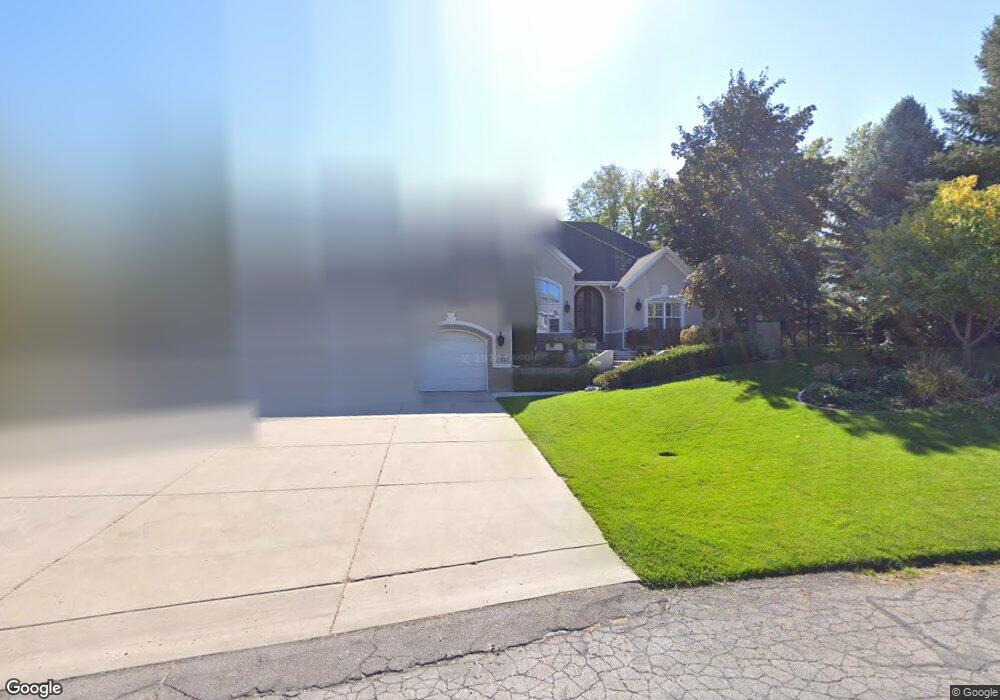
This home is located at 7757 Plum Creek Ln, Sandy, UT 84093 and is currently estimated at $1,599,247, approximately $398 per square foot. 7757 Plum Creek Ln is a home located in Salt Lake County with nearby schools including Oakdale School, Albion Middle School, and Brighton High School.
Ownership History
Date
Name
Owned For
Owner Type
Purchase Details
Closed on
Dec 13, 1999
Sold by
Broadwater Paul M and Broadwater Cherie
Bought by
Broadwater Paul M and Broadwater Cherie
Current Estimated Value
Purchase Details
Closed on
Oct 1, 1996
Sold by
Pope Judith Ann
Bought by
Broadwater Cherie
Purchase Details
Closed on
Jun 17, 1996
Sold by
Pope Steven R and Pope Judith Ann
Bought by
Pope Judith Ann
Home Financials for this Owner
Home Financials are based on the most recent Mortgage that was taken out on this home.
Original Mortgage
$57,000
Interest Rate
8.25%
Purchase Details
Closed on
Feb 18, 1994
Sold by
Pope Steven R and Pope Judith A
Bought by
Pope Steven R and Pope Judith Ann
Create a Home Valuation Report for This Property
The Home Valuation Report is an in-depth analysis detailing your home's value as well as a comparison with similar homes in the area
Home Values in the Area
Average Home Value in this Area
Purchase History
| Date | Buyer | Sale Price | Title Company |
|---|---|---|---|
| Broadwater Paul M | -- | -- | |
| Broadwater Cherie | -- | -- | |
| Pope Judith Ann | -- | -- | |
| Pope Steven R | -- | -- |
Source: Public Records
Mortgage History
| Date | Status | Borrower | Loan Amount |
|---|---|---|---|
| Previous Owner | Pope Judith Ann | $57,000 |
Source: Public Records
Tax History Compared to Growth
Tax History
| Year | Tax Paid | Tax Assessment Tax Assessment Total Assessment is a certain percentage of the fair market value that is determined by local assessors to be the total taxable value of land and additions on the property. | Land | Improvement |
|---|---|---|---|---|
| 2025 | $6,263 | $1,302,500 | $486,000 | $816,500 |
| 2024 | $6,263 | $1,197,200 | $448,600 | $748,600 |
| 2023 | $6,154 | $1,147,300 | $431,300 | $716,000 |
| 2022 | $6,363 | $1,151,900 | $422,900 | $729,000 |
| 2021 | $5,830 | $902,300 | $313,300 | $589,000 |
| 2020 | $5,734 | $837,100 | $313,300 | $523,800 |
| 2019 | $5,882 | $836,400 | $308,000 | $528,400 |
| 2018 | $4,991 | $726,500 | $308,000 | $418,500 |
| 2017 | $4,723 | $670,400 | $308,000 | $362,400 |
| 2016 | $4,942 | $681,400 | $299,000 | $382,400 |
| 2015 | $4,249 | $542,600 | $264,900 | $277,700 |
| 2014 | $4,100 | $509,600 | $259,200 | $250,400 |
Source: Public Records
Map
Nearby Homes
- 7723 S Plum Creek Ln
- 7641 Mary Esther Cir
- 1341 E Creek Rd
- 7364 S Chris Ln
- 1335 E Milne Ln
- 1695 E Ensign Place
- 1325 E Milne Ln
- 1222 E Waterside Cove Unit 31
- 7138 S Chris Ln
- 1212 E Waterside Cove Unit 12
- 1212 E Waterside Cove Unit 10
- 1263 E Ridge Meadow Ln Unit 6R
- 1205 E Waterside Cove Unit 13
- 1597 Paulista Way
- 1196 E Waterside Cove Unit 22
- 7265 S 1950 E Unit 14
- 7734 S 1100 E
- 1263 E Cottonwood Hills Dr
- 1235 E Cottonwood Hills Dr
- 1327 Madrid Way
- 7745 S Plum Creek Ln
- 7745 Plum Creek Ln
- 1597 Chapel Oaks Cir
- 7763 Plum Creek Ln
- 1618 Cotswold Cir
- 7763 S Plum Creek Ln
- 1613 E Cotswold Cir
- 1585 Chapel Oaks Cir
- 1613 Cotswold Cir
- 1621 Matlock Ct
- 1608 Chapel Oaks Cir
- 7754 S Plum Creek Ln
- 7730 S Plum Creek Ln
- 7730 Plum Creek Ln
- 7754 Plum Creek Ln
- 1563 Chapel Oaks Cir
- 1614 Matlock Ct
- 1619 E Cotswold Cir
- 7684 Keswick Rd
- 7760 Plum Creek Ln