7757 Shannon Way Maple Falls, WA 98266
Estimated Value: $363,000 - $427,000
2
Beds
1
Bath
1,252
Sq Ft
$316/Sq Ft
Est. Value
About This Home
This home is located at 7757 Shannon Way, Maple Falls, WA 98266 and is currently estimated at $395,148, approximately $315 per square foot. 7757 Shannon Way is a home located in Whatcom County with nearby schools including Mount Baker Senior High School.
Ownership History
Date
Name
Owned For
Owner Type
Purchase Details
Closed on
Apr 26, 2021
Sold by
Wilson Marc and Wilson Renee
Bought by
Szostak Christine
Current Estimated Value
Home Financials for this Owner
Home Financials are based on the most recent Mortgage that was taken out on this home.
Original Mortgage
$268,000
Outstanding Balance
$242,495
Interest Rate
3%
Mortgage Type
New Conventional
Estimated Equity
$152,653
Purchase Details
Closed on
Mar 7, 2017
Sold by
Us Bank National Association
Bought by
Wilson Marc and Wilson Renee
Purchase Details
Closed on
Jan 5, 2007
Sold by
Reynolds Jennie Marie
Bought by
Melitz Jeff
Home Financials for this Owner
Home Financials are based on the most recent Mortgage that was taken out on this home.
Original Mortgage
$135,000
Interest Rate
6.12%
Mortgage Type
Balloon
Purchase Details
Closed on
Jan 26, 2006
Sold by
Dahms Robert F and Dahms Christy
Bought by
Reynolds Jennie Marie
Home Financials for this Owner
Home Financials are based on the most recent Mortgage that was taken out on this home.
Original Mortgage
$103,040
Interest Rate
6.28%
Mortgage Type
Fannie Mae Freddie Mac
Create a Home Valuation Report for This Property
The Home Valuation Report is an in-depth analysis detailing your home's value as well as a comparison with similar homes in the area
Home Values in the Area
Average Home Value in this Area
Purchase History
| Date | Buyer | Sale Price | Title Company |
|---|---|---|---|
| Szostak Christine | $335,000 | Chicago Title Company Of Wa | |
| Wilson Marc | $82,000 | Nextitle | |
| Melitz Jeff | $83,743 | Chicago Title Insurance | |
| Reynolds Jennie Marie | $129,080 | Stewart Title Company |
Source: Public Records
Mortgage History
| Date | Status | Borrower | Loan Amount |
|---|---|---|---|
| Open | Szostak Christine | $268,000 | |
| Previous Owner | Melitz Jeff | $135,000 | |
| Previous Owner | Reynolds Jennie Marie | $103,040 |
Source: Public Records
Tax History Compared to Growth
Tax History
| Year | Tax Paid | Tax Assessment Tax Assessment Total Assessment is a certain percentage of the fair market value that is determined by local assessors to be the total taxable value of land and additions on the property. | Land | Improvement |
|---|---|---|---|---|
| 2024 | $2,261 | $326,917 | $144,000 | $182,917 |
| 2023 | $2,261 | $305,941 | $114,680 | $191,261 |
| 2022 | $1,800 | $244,755 | $91,745 | $153,010 |
| 2021 | $1,584 | $194,254 | $72,815 | $121,439 |
| 2020 | $1,651 | $152,957 | $57,335 | $95,622 |
| 2019 | $1,342 | $152,957 | $57,335 | $95,622 |
| 2018 | $1,644 | $133,389 | $50,000 | $83,389 |
| 2017 | $1,393 | $128,903 | $46,960 | $81,943 |
| 2016 | $1,352 | $116,331 | $42,400 | $73,931 |
| 2015 | $1,266 | $112,028 | $41,400 | $70,628 |
| 2014 | -- | $105,282 | $38,800 | $66,482 |
| 2013 | -- | $110,277 | $40,000 | $70,277 |
Source: Public Records
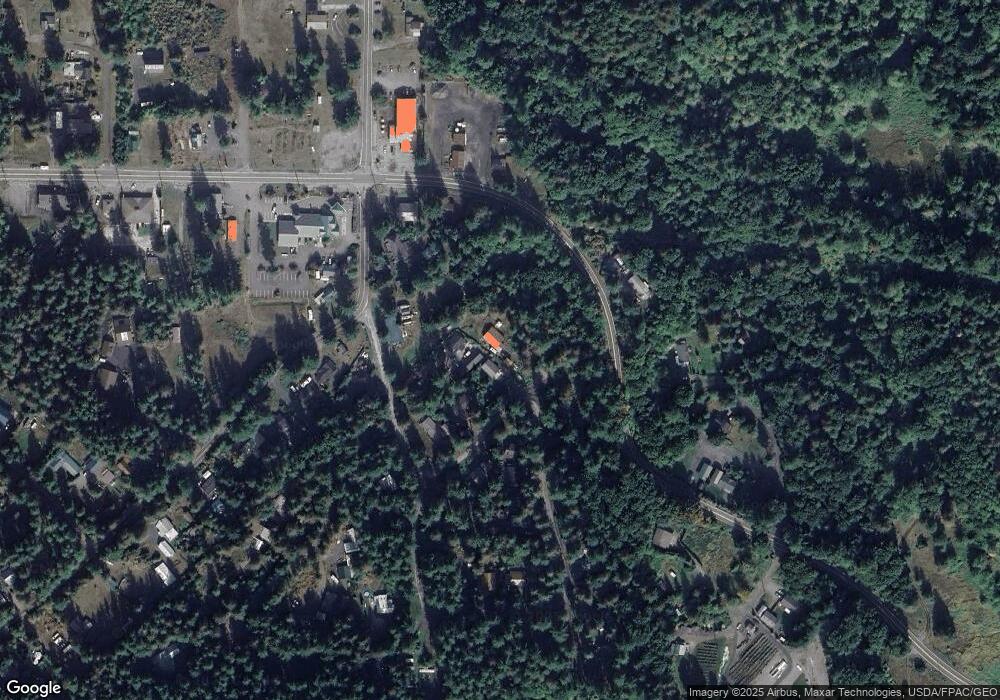
Map
Nearby Homes
- 7461 Mt Baker Hwy
- 7417 Woodshire Rd
- 7929 Silver Lake Rd
- 90 4 Christmas Tree Cir
- 7326 Mount Baker Hwy
- 178 4 Christmas Tree Cir
- 59 4 Christmas Tree Cir
- 165 4 Christmas Tree Cir
- 67 4 Christmas Tree Cir
- 171 4 Christmas Tree Cir
- 61 4 Christmas Tree Cir
- 35 Branch Cir
- 108 Christmas Tree Dr
- 48 4 Branch Cir
- 32 4 Branch Cir
- 25 4 Drial Loop
- 47 Wilderness Way
- 123 4 Drial Loop
- 24 4 Drial Loop
- 104 Pioneer Cir
- 7759 Shannon Way
- 7762 Cascades Dr
- 7781 Shannon Way
- 7767 Shannon Way
- 7764 Shannon Way
- 7752 Shannon Way
- 7753 Shannon Way
- 7784 Silver Lake Rd
- 7748 Shannon Way
- 7748 Viewridge Dr
- 7749 Shannon Way
- 7744 View Ridge Rd
- 7739 View Ridge Rd
- 7743 View Ridge Dr
- 7743 View Ridge Dr
- 7744 Viewridge Dr
- 7735 View Ridge Rd
- 7736 View Ridge Rd
- 7771 Cascades Dr
- 7786 Silver Lake Rd