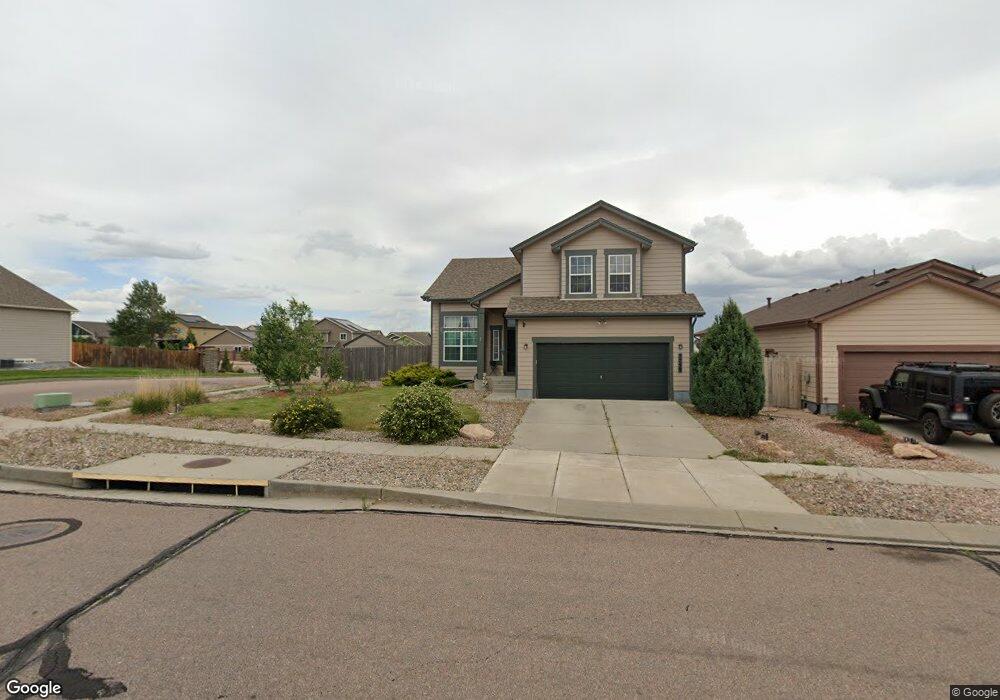
7758 Chasewood Loop Colorado Springs, CO 80908
Estimated Value: $484,748 - $553,000
4
Beds
3
Baths
2,964
Sq Ft
$177/Sq Ft
Est. Value
About This Home
This home is located at 7758 Chasewood Loop, Colorado Springs, CO 80908 and is currently estimated at $523,187, approximately $176 per square foot. 7758 Chasewood Loop is a home located in El Paso County with nearby schools including Inspiration View Elementary School, Skyview Middle School, and Vista Ridge High School.
Ownership History
Date
Name
Owned For
Owner Type
Purchase Details
Closed on
Mar 25, 2022
Sold by
Bechthold Dawn M
Bought by
Mann Angel
Current Estimated Value
Home Financials for this Owner
Home Financials are based on the most recent Mortgage that was taken out on this home.
Original Mortgage
$388,800
Outstanding Balance
$365,251
Interest Rate
4.42%
Mortgage Type
New Conventional
Estimated Equity
$157,936
Purchase Details
Closed on
Mar 8, 2016
Sold by
Chandler Mark and Chandler Elisha
Bought by
Bechthhold Dawn M and Armendariz Avelina
Home Financials for this Owner
Home Financials are based on the most recent Mortgage that was taken out on this home.
Original Mortgage
$258,236
Interest Rate
4.12%
Mortgage Type
FHA
Purchase Details
Closed on
Jul 22, 2011
Sold by
Aspen View Homes Llc
Bought by
Chandler Mark and Chandler Elisha
Home Financials for this Owner
Home Financials are based on the most recent Mortgage that was taken out on this home.
Original Mortgage
$252,259
Interest Rate
3.75%
Mortgage Type
VA
Create a Home Valuation Report for This Property
The Home Valuation Report is an in-depth analysis detailing your home's value as well as a comparison with similar homes in the area
Home Values in the Area
Average Home Value in this Area
Purchase History
| Date | Buyer | Sale Price | Title Company |
|---|---|---|---|
| Mann Angel | $486,000 | Stewart Title Company | |
| Bechthhold Dawn M | $263,000 | Heritage Title | |
| Chandler Mark | $246,950 | None Available |
Source: Public Records
Mortgage History
| Date | Status | Borrower | Loan Amount |
|---|---|---|---|
| Open | Mann Angel | $388,800 | |
| Previous Owner | Bechthhold Dawn M | $258,236 | |
| Previous Owner | Chandler Mark | $252,259 |
Source: Public Records
Tax History Compared to Growth
Tax History
| Year | Tax Paid | Tax Assessment Tax Assessment Total Assessment is a certain percentage of the fair market value that is determined by local assessors to be the total taxable value of land and additions on the property. | Land | Improvement |
|---|---|---|---|---|
| 2025 | $3,341 | $35,770 | -- | -- |
| 2024 | $3,220 | $34,390 | $6,030 | $28,360 |
| 2023 | $3,220 | $34,390 | $6,030 | $28,360 |
| 2022 | $2,793 | $24,990 | $5,590 | $19,400 |
| 2021 | $2,984 | $25,710 | $5,760 | $19,950 |
| 2020 | $2,804 | $22,410 | $5,010 | $17,400 |
| 2019 | $2,866 | $22,410 | $5,010 | $17,400 |
| 2018 | $2,361 | $18,710 | $4,320 | $14,390 |
| 2017 | $2,368 | $18,710 | $4,320 | $14,390 |
| 2016 | $2,270 | $18,530 | $4,140 | $14,390 |
| 2015 | $2,309 | $18,530 | $4,140 | $14,390 |
| 2014 | $2,266 | $17,990 | $4,140 | $13,850 |
Source: Public Records
Map
Nearby Homes
- 7930 Lightwood Way
- 7577 Chasewood Loop
- 7758 Camille Ct
- 6949 Dusty Miller Way
- 7898 Chasewood Loop
- 9194 Old Divide Dr
- 7716 Kiana Dr
- 8308 Needle Drop Ct
- 8127 Mockorange Heights
- 6829 Red Cardinal Loop
- 8651 Dry Needle Place
- 6806 Red Cardinal Loop
- 8721 Dry Needle Place
- 7718 Wagonwood Place
- 8437 Salt Brush Rd
- 9085 Vanderwood Rd
- 7991 Martinwood Place
- 7983 Martinwood Place
- 8844 Vanderwood Rd
- 8142 Misty Moon Dr
- 7768 Chasewood Loop
- 808 Chasewood Loop
- 6993 Sierra Meadows Dr
- 7778 Chasewood Loop
- 7698 Chasewood Loop
- 6956 Daisy Hill Ln
- 6983 Sierra Meadows Dr
- 7788 Chasewood Loop
- 6994 Sierra Meadows Dr
- 7688 Chasewood Loop
- 6984 Sierra Meadows Dr
- 6946 Daisy Hill Ln
- 7798 Chasewood Loop
- 6973 Sierra Meadows Dr
- 7166 Red Cardinal Loop
- 7678 Chasewood Loop
- 7160 Red Cardinal Loop
- 7172 Red Cardinal Loop
- 6974 Sierra Meadows Dr
- 6963 Sierra Meadows Dr