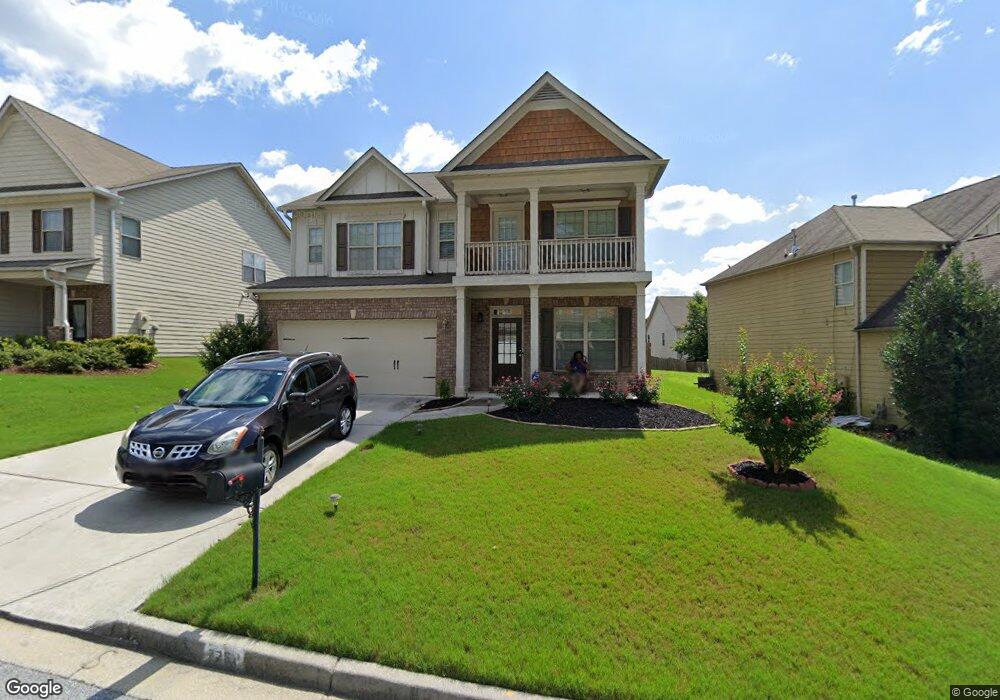
7758 Fabled Point Unit 865 Union City, GA 30291
Estimated Value: $325,000 - $364,000
3
Beds
3
Baths
2,706
Sq Ft
$124/Sq Ft
Est. Value
About This Home
This home is located at 7758 Fabled Point Unit 865, Union City, GA 30291 and is currently estimated at $336,859, approximately $124 per square foot. 7758 Fabled Point Unit 865 is a home located in Fulton County with nearby schools including Oakley Elementary School, Bear Creek Middle School, and Creekside High School.
Ownership History
Date
Name
Owned For
Owner Type
Purchase Details
Closed on
May 29, 2019
Sold by
Nguyen Tri Bad
Bought by
Nesbitt Shavon Moniek
Current Estimated Value
Home Financials for this Owner
Home Financials are based on the most recent Mortgage that was taken out on this home.
Original Mortgage
$194,413
Outstanding Balance
$173,487
Interest Rate
4.87%
Mortgage Type
FHA
Estimated Equity
$163,372
Purchase Details
Closed on
Jun 21, 2013
Sold by
Secretary Of Housing And U
Bought by
Nguyen Tri Bao
Home Financials for this Owner
Home Financials are based on the most recent Mortgage that was taken out on this home.
Original Mortgage
$104,426
Interest Rate
3.87%
Mortgage Type
FHA
Purchase Details
Closed on
Jun 5, 2012
Sold by
Bank Of America Na
Bought by
Secretary Of Housing And Urban
Purchase Details
Closed on
Feb 26, 2009
Sold by
Dr Horton Inc
Bought by
Glover Nathaniel
Home Financials for this Owner
Home Financials are based on the most recent Mortgage that was taken out on this home.
Original Mortgage
$169,759
Interest Rate
5.15%
Mortgage Type
FHA
Create a Home Valuation Report for This Property
The Home Valuation Report is an in-depth analysis detailing your home's value as well as a comparison with similar homes in the area
Home Values in the Area
Average Home Value in this Area
Purchase History
| Date | Buyer | Sale Price | Title Company |
|---|---|---|---|
| Nesbitt Shavon Moniek | $198,000 | -- | |
| Nguyen Tri Bao | $102,400 | -- | |
| Secretary Of Housing And Urban | $186,473 | -- | |
| Bank Of America Na | $186,473 | -- | |
| Glover Nathaniel | $172,000 | -- |
Source: Public Records
Mortgage History
| Date | Status | Borrower | Loan Amount |
|---|---|---|---|
| Open | Nesbitt Shavon Moniek | $194,413 | |
| Previous Owner | Nguyen Tri Bao | $104,426 | |
| Previous Owner | Glover Nathaniel | $169,759 |
Source: Public Records
Tax History Compared to Growth
Tax History
| Year | Tax Paid | Tax Assessment Tax Assessment Total Assessment is a certain percentage of the fair market value that is determined by local assessors to be the total taxable value of land and additions on the property. | Land | Improvement |
|---|---|---|---|---|
| 2025 | $2,361 | $139,080 | $24,400 | $114,680 |
| 2023 | $3,820 | $135,320 | $19,960 | $115,360 |
| 2022 | $2,216 | $91,240 | $12,600 | $78,640 |
| 2021 | $2,176 | $88,600 | $12,240 | $76,360 |
| 2020 | $2,922 | $71,800 | $5,440 | $66,360 |
| 2019 | $1,700 | $64,360 | $4,800 | $59,560 |
| 2018 | $1,583 | $58,600 | $4,720 | $53,880 |
| 2017 | $1,618 | $59,760 | $7,760 | $52,000 |
| 2016 | $1,543 | $59,760 | $7,760 | $52,000 |
| 2015 | $1,547 | $59,760 | $7,760 | $52,000 |
| 2014 | $2,192 | $50,840 | $6,040 | $44,800 |
Source: Public Records
Map
Nearby Homes
- 7758 Fabled Point
- 7762 Fabled Point
- 7754 Fabled Point Unit 866
- 0 Fabled Point Unit 8526440
- 0 Fabled Point Unit 7055555
- 0 Fabled Point Unit 8878181
- 0 Fabled Point Unit 3220990
- 0 Fabled Point Unit 7059220
- 0 Fabled Point Unit 8193573
- 0 Fabled Point Unit 8282221
- 0 Fabled Point
- 7770 Fabled Point Unit 863
- 7770 Fabled Point
- 7750 Fabled Point Unit 867
- 7731 Fanlight Place
- 7735 Fanlight Place Unit 874
- 7735 Fanlight Place
- 7727 Fanlight Place
- 7723 Fanlight Place Unit 871
- 7723 Fanlight Place