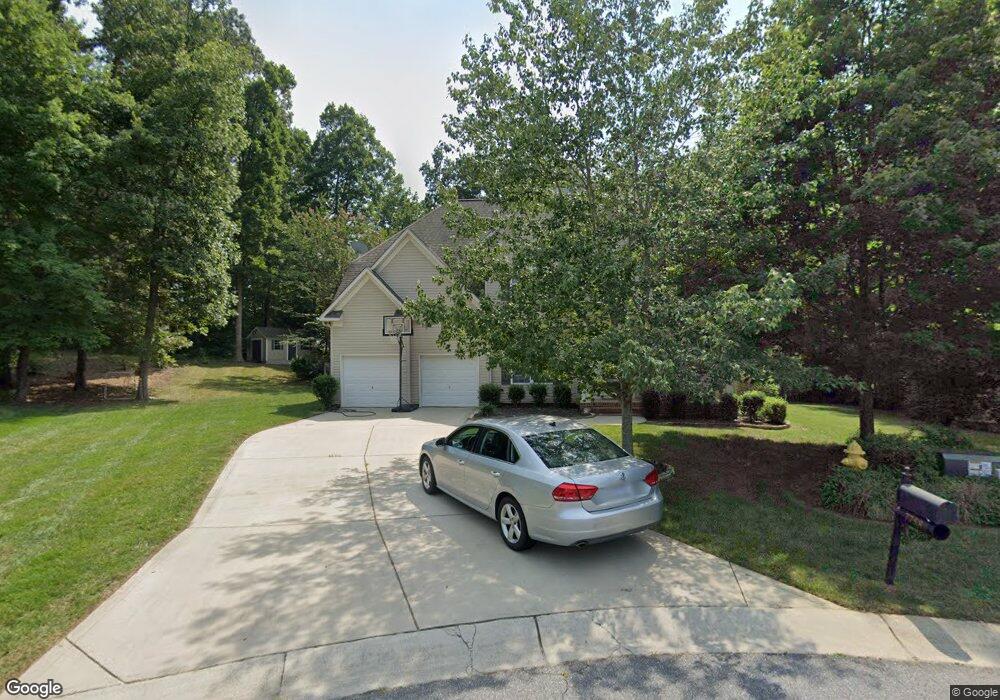
7758 Woodcrest Dr Stanley, NC 28164
Estimated Value: $601,000 - $634,127
5
Beds
3
Baths
3,380
Sq Ft
$183/Sq Ft
Est. Value
About This Home
This home is located at 7758 Woodcrest Dr, Stanley, NC 28164 and is currently estimated at $618,032, approximately $182 per square foot. 7758 Woodcrest Dr is a home located in Lincoln County with nearby schools including Catawba Springs Elementary School, East Lincoln Middle School, and East Lincoln High School.
Ownership History
Date
Name
Owned For
Owner Type
Purchase Details
Closed on
Jul 7, 2011
Sold by
Mordas John S and Mordas Patricia C
Bought by
Strauss Ralf and Strauss Melanie
Current Estimated Value
Home Financials for this Owner
Home Financials are based on the most recent Mortgage that was taken out on this home.
Original Mortgage
$223,200
Outstanding Balance
$153,989
Interest Rate
4.57%
Mortgage Type
New Conventional
Estimated Equity
$464,043
Purchase Details
Closed on
Jul 29, 2005
Sold by
Niblock Development Corp
Bought by
Mordas John S and Mordas Patricia C
Home Financials for this Owner
Home Financials are based on the most recent Mortgage that was taken out on this home.
Original Mortgage
$180,000
Interest Rate
5.48%
Mortgage Type
Credit Line Revolving
Purchase Details
Closed on
Mar 17, 2005
Sold by
Waterside Crossing Residential Llc
Bought by
Niblock Development Corp
Create a Home Valuation Report for This Property
The Home Valuation Report is an in-depth analysis detailing your home's value as well as a comparison with similar homes in the area
Home Values in the Area
Average Home Value in this Area
Purchase History
| Date | Buyer | Sale Price | Title Company |
|---|---|---|---|
| Strauss Ralf | $279,000 | None Available | |
| Mordas John S | $300,000 | None Available | |
| Niblock Development Corp | $402,000 | None Available |
Source: Public Records
Mortgage History
| Date | Status | Borrower | Loan Amount |
|---|---|---|---|
| Open | Strauss Ralf | $223,200 | |
| Previous Owner | Mordas John S | $180,000 |
Source: Public Records
Tax History Compared to Growth
Tax History
| Year | Tax Paid | Tax Assessment Tax Assessment Total Assessment is a certain percentage of the fair market value that is determined by local assessors to be the total taxable value of land and additions on the property. | Land | Improvement |
|---|---|---|---|---|
| 2025 | $3,642 | $579,725 | $82,000 | $497,725 |
| 2024 | $3,606 | $579,725 | $82,000 | $497,725 |
| 2023 | $3,601 | $579,725 | $82,000 | $497,725 |
| 2022 | $2,674 | $346,313 | $52,000 | $294,313 |
| 2021 | $2,692 | $346,313 | $52,000 | $294,313 |
| 2020 | $2,414 | $346,313 | $52,000 | $294,313 |
| 2019 | $2,414 | $346,313 | $52,000 | $294,313 |
| 2018 | $2,161 | $294,250 | $46,500 | $247,750 |
| 2017 | $2,060 | $294,250 | $46,500 | $247,750 |
| 2016 | $2,051 | $294,250 | $46,500 | $247,750 |
| 2015 | $2,187 | $294,250 | $46,500 | $247,750 |
| 2014 | $1,869 | $260,488 | $46,500 | $213,988 |
Source: Public Records
Map
Nearby Homes
- 7508 Turkey Trot Dr
- 796 Cedarwood Ct
- 7484 Turkey Trot Dr
- 963 Brookdale Ln
- 955 Brookdale Ln Unit 436
- Maple Plan at Sifford Farms
- 7065 Stella Place
- 7016 Stella Place
- 7013 Stella Place
- 7005 Stella Place
- 7012 Stella Place
- 7157 Sedgebrook Dr W
- 7700 Sedgebrook Dr E
- 1594 High Ridge Dr
- 1595 High Ridge Dr
- 7275 Woodcock Trail
- 1230 Carrington Dr
- 1247 Carrington Dr
- 1259 Carrington Dr
- 7736 Turnberry Ln
- 7755 Woodcrest Dr
- 965 Pinkney Place
- 953 Pinkney Place
- 973 Pinkney Place
- 7747 Woodcrest Dr
- 7746 Woodcrest Dr
- 939 Pinkney Place
- 931 Pinkney Place
- 7739 Woodcrest Dr
- 983 Pinkney Place
- 925 Pinkney Place
- 7740 Woodcrest Dr Unit 373
- 7740 Woodcrest Dr
- 7733 Woodcrest Dr
- 989 Pinkney Place
- 970 Pinkney Place
- 915 Pinkney Place
- 952 Pinkney Place
- 7734 Woodcrest Dr
- 982 Pinkney Place