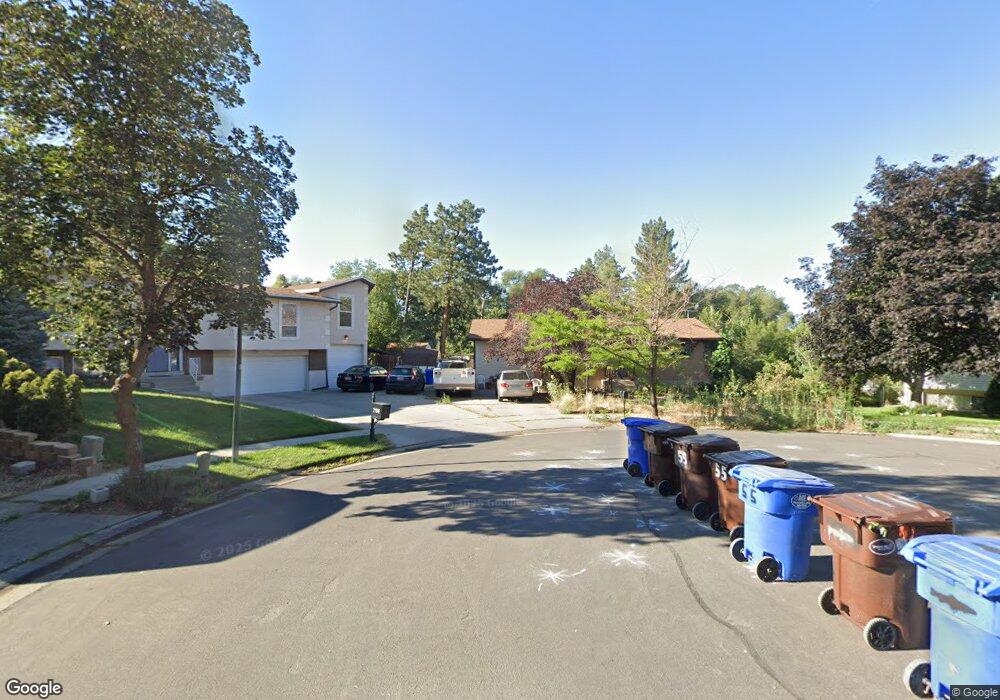
7759 S 1100 E Midvale, UT 84047
Estimated Value: $506,535 - $588,000
3
Beds
2
Baths
1,344
Sq Ft
$418/Sq Ft
Est. Value
About This Home
This home is located at 7759 S 1100 E, Midvale, UT 84047 and is currently estimated at $561,634, approximately $417 per square foot. 7759 S 1100 E is a home located in Salt Lake County with nearby schools including Oakdale School, Hillcrest High School, and Union Middle School.
Ownership History
Date
Name
Owned For
Owner Type
Purchase Details
Closed on
Feb 20, 2001
Sold by
Vandegrift Julia E and Burke Julia E
Bought by
Vandegrift Julia E
Current Estimated Value
Home Financials for this Owner
Home Financials are based on the most recent Mortgage that was taken out on this home.
Original Mortgage
$71,400
Outstanding Balance
$25,424
Interest Rate
6.89%
Estimated Equity
$536,210
Purchase Details
Closed on
Nov 10, 1997
Sold by
Burke Julia E and Burke Julia V
Bought by
Burke Julia E
Home Financials for this Owner
Home Financials are based on the most recent Mortgage that was taken out on this home.
Original Mortgage
$74,000
Interest Rate
7.3%
Purchase Details
Closed on
Nov 7, 1997
Sold by
Burke Harold R
Bought by
Burke Julia
Home Financials for this Owner
Home Financials are based on the most recent Mortgage that was taken out on this home.
Original Mortgage
$74,000
Interest Rate
7.3%
Create a Home Valuation Report for This Property
The Home Valuation Report is an in-depth analysis detailing your home's value as well as a comparison with similar homes in the area
Home Values in the Area
Average Home Value in this Area
Purchase History
| Date | Buyer | Sale Price | Title Company |
|---|---|---|---|
| Vandegrift Julia E | -- | Backman Stewart Title Servic | |
| Burke Julia E | -- | -- | |
| Burke Julia | -- | -- |
Source: Public Records
Mortgage History
| Date | Status | Borrower | Loan Amount |
|---|---|---|---|
| Open | Vandegrift Julia E | $71,400 | |
| Closed | Burke Julia E | $74,000 |
Source: Public Records
Tax History
| Year | Tax Paid | Tax Assessment Tax Assessment Total Assessment is a certain percentage of the fair market value that is determined by local assessors to be the total taxable value of land and additions on the property. | Land | Improvement |
|---|---|---|---|---|
| 2025 | $2,654 | $468,600 | $136,000 | $332,600 |
| 2024 | $2,654 | $445,700 | $127,100 | $318,600 |
| 2023 | $2,620 | $436,600 | $120,800 | $315,800 |
| 2022 | $2,727 | $446,200 | $118,500 | $327,700 |
| 2021 | $2,064 | $289,600 | $103,000 | $186,600 |
| 2020 | $2,006 | $266,600 | $90,600 | $176,000 |
| 2019 | $1,888 | $244,900 | $90,600 | $154,300 |
| 2016 | $1,773 | $218,100 | $82,400 | $135,700 |
Source: Public Records
Map
Nearby Homes
- 7755 S 1130 E
- 954 E 7725 S
- 7614 S 1000 E
- 7899 S 930 E
- 1341 E Creek Rd
- 7819 S Spruce Tree Ln
- 973 E Taliesen Cove Unit 203
- 8136 S Cottonwood Hills Cir
- 798 E Spruce Tree Ln
- 1228 E Waterside Cove Unit 12
- 1222 E Waterside Cove Unit 31
- 1222 E Waterside Cove Unit 10
- 1205 E Waterside Cove Unit 13
- 1212 E Waterside Cove Unit 12
- 1212 E Waterside Cove Unit 10
- 7692 Chad St
- 1335 E Milne Ln
- 955 E Creekhill Ln Unit 31
- 1196 E Waterside Cove Unit 22
- 1190 E Waterside Cove Unit 10
Your Personal Tour Guide
Ask me questions while you tour the home.